
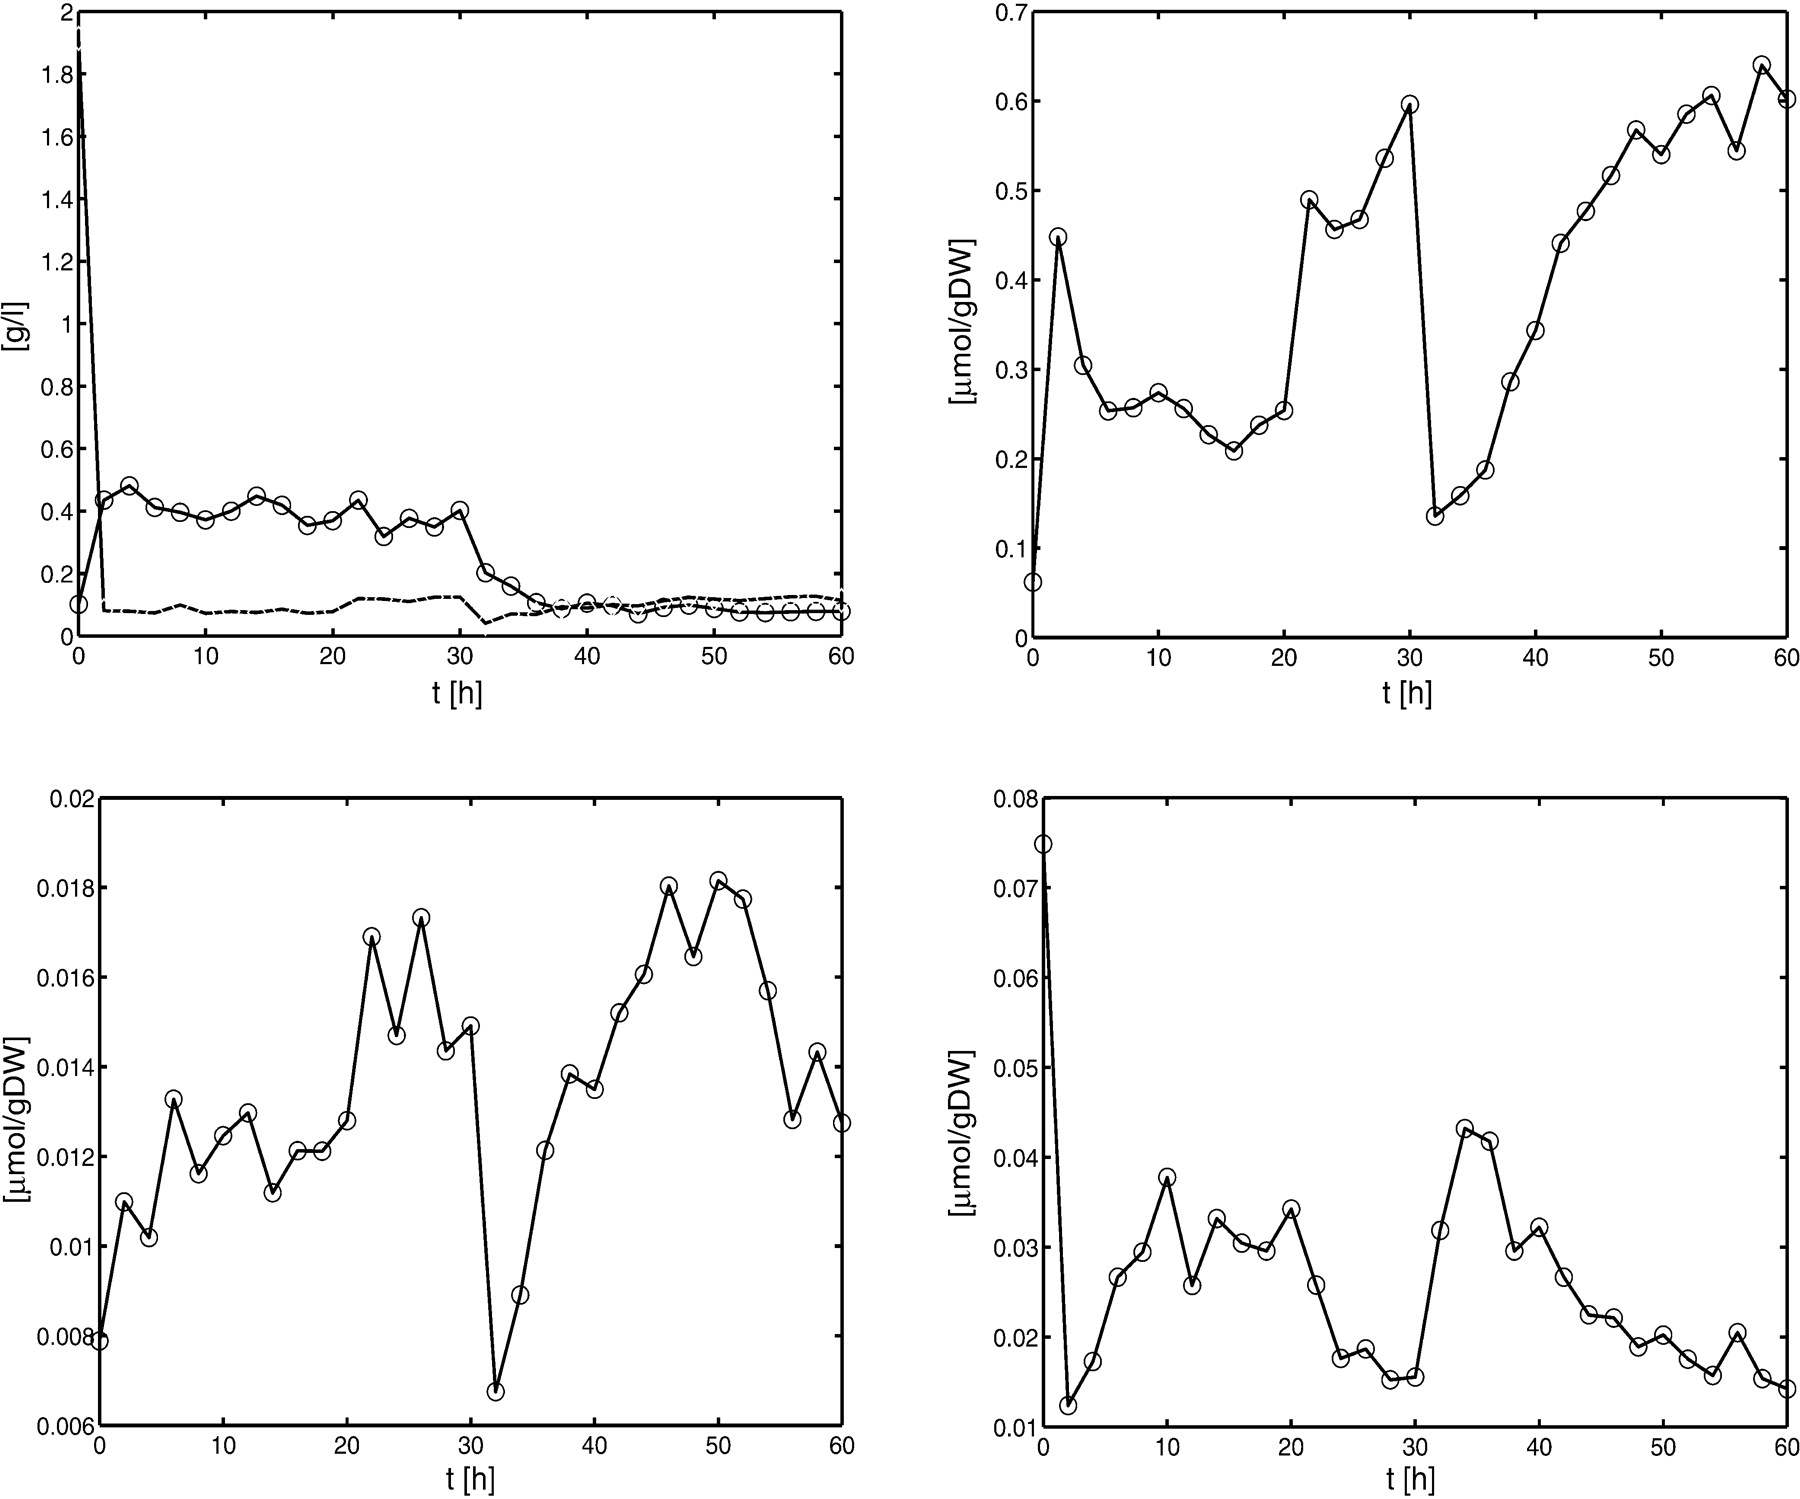
Figure 2
Time series data for biomass and substrate (upper left), for substance M1 (upper right), for substance M2 (lower left), and for substance M3 (lower right). Data were generated as described above. Numerical values of the data are given in the Appendix and can be downloaded from the Web site given in the problem formulation.


