
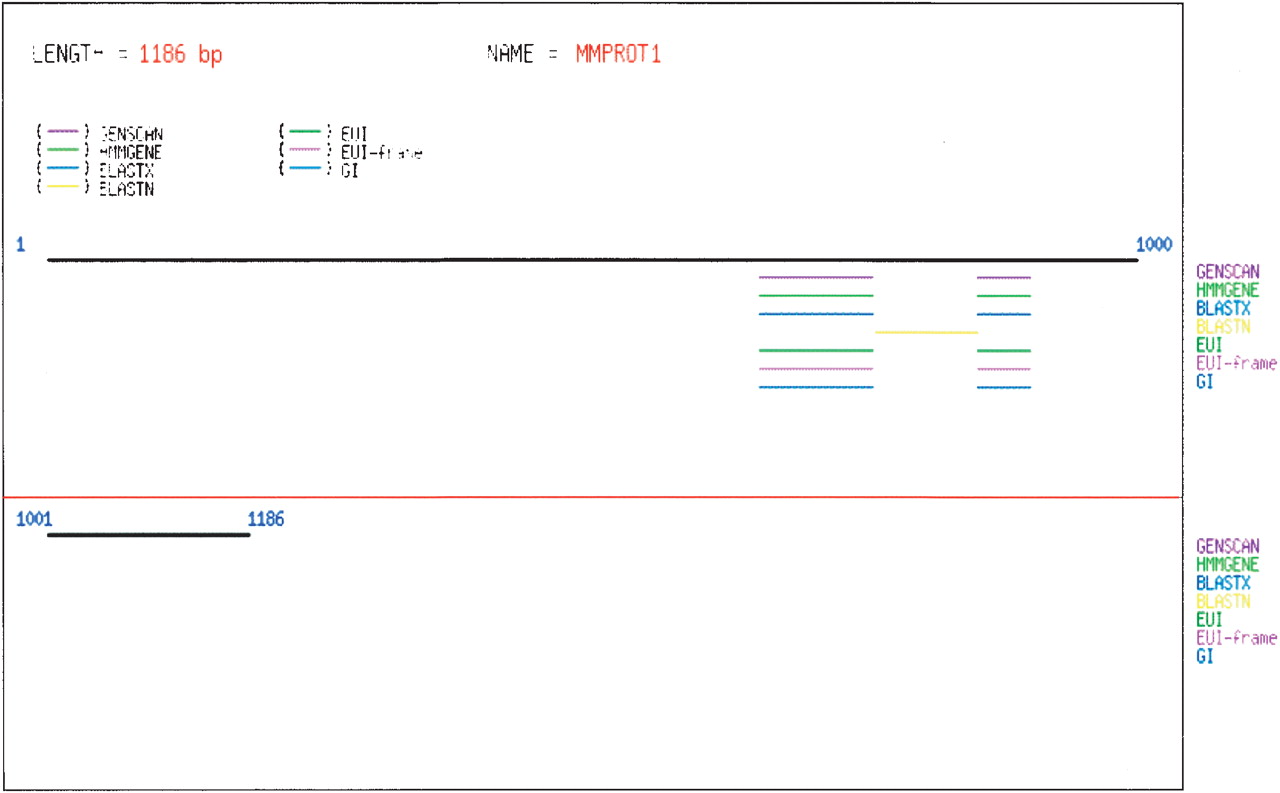
Figure 1
Graphical output from the EGPred server for a mouse gene (GenBank accession no. X07625, Locus ID MMPROT1) on default parameters. The solid black line indicates the query sequence. The predictions are represented as colored lines. The color code for each program is indicated at the top of the image. Longer sequences are broken into segments of 1000 bp and separated by a long red line. The length of query sequence is indicated at the top of the output image.


