
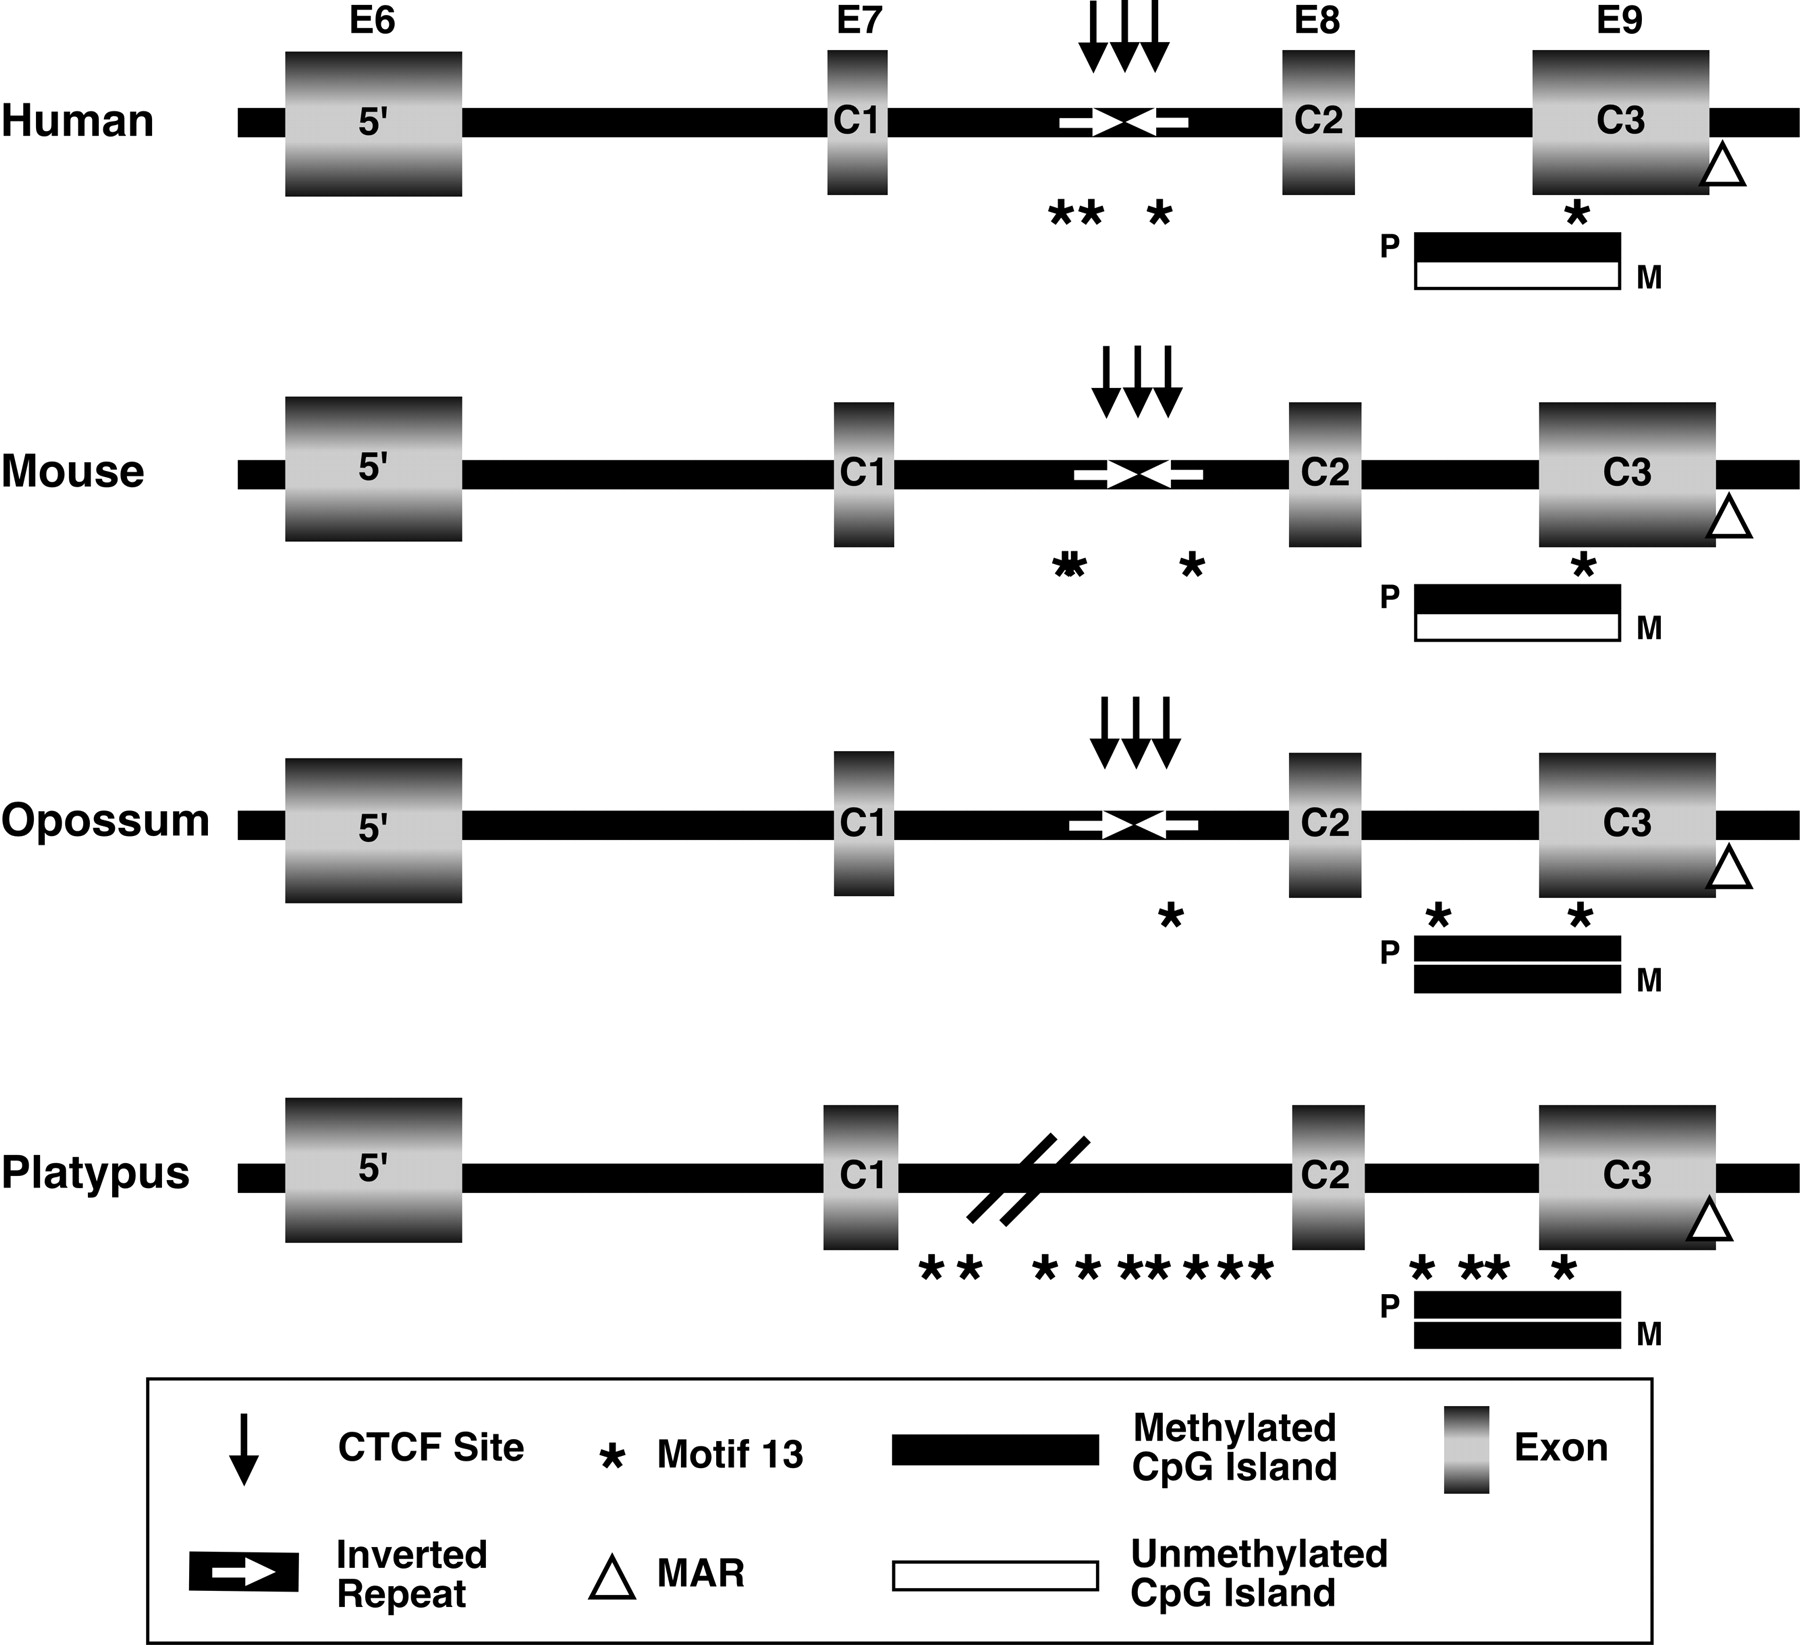
Figure 2
Schematic representation of multispecies alignments of human, mouse, opossum, and platypus IGF2. (Rectangles) exons; (horizontal bars) CpG islands (filled, methylated; unfilled, unmethylated); (black arrows) consensus CTCF-binding sites; (triangle) putative matrix attachment region; (*) “imprint-specific” motif 13 sequences (Wang et al. 2004); (white arrows) inverted repeat regions; (E) exon; (C) coding exon.


