
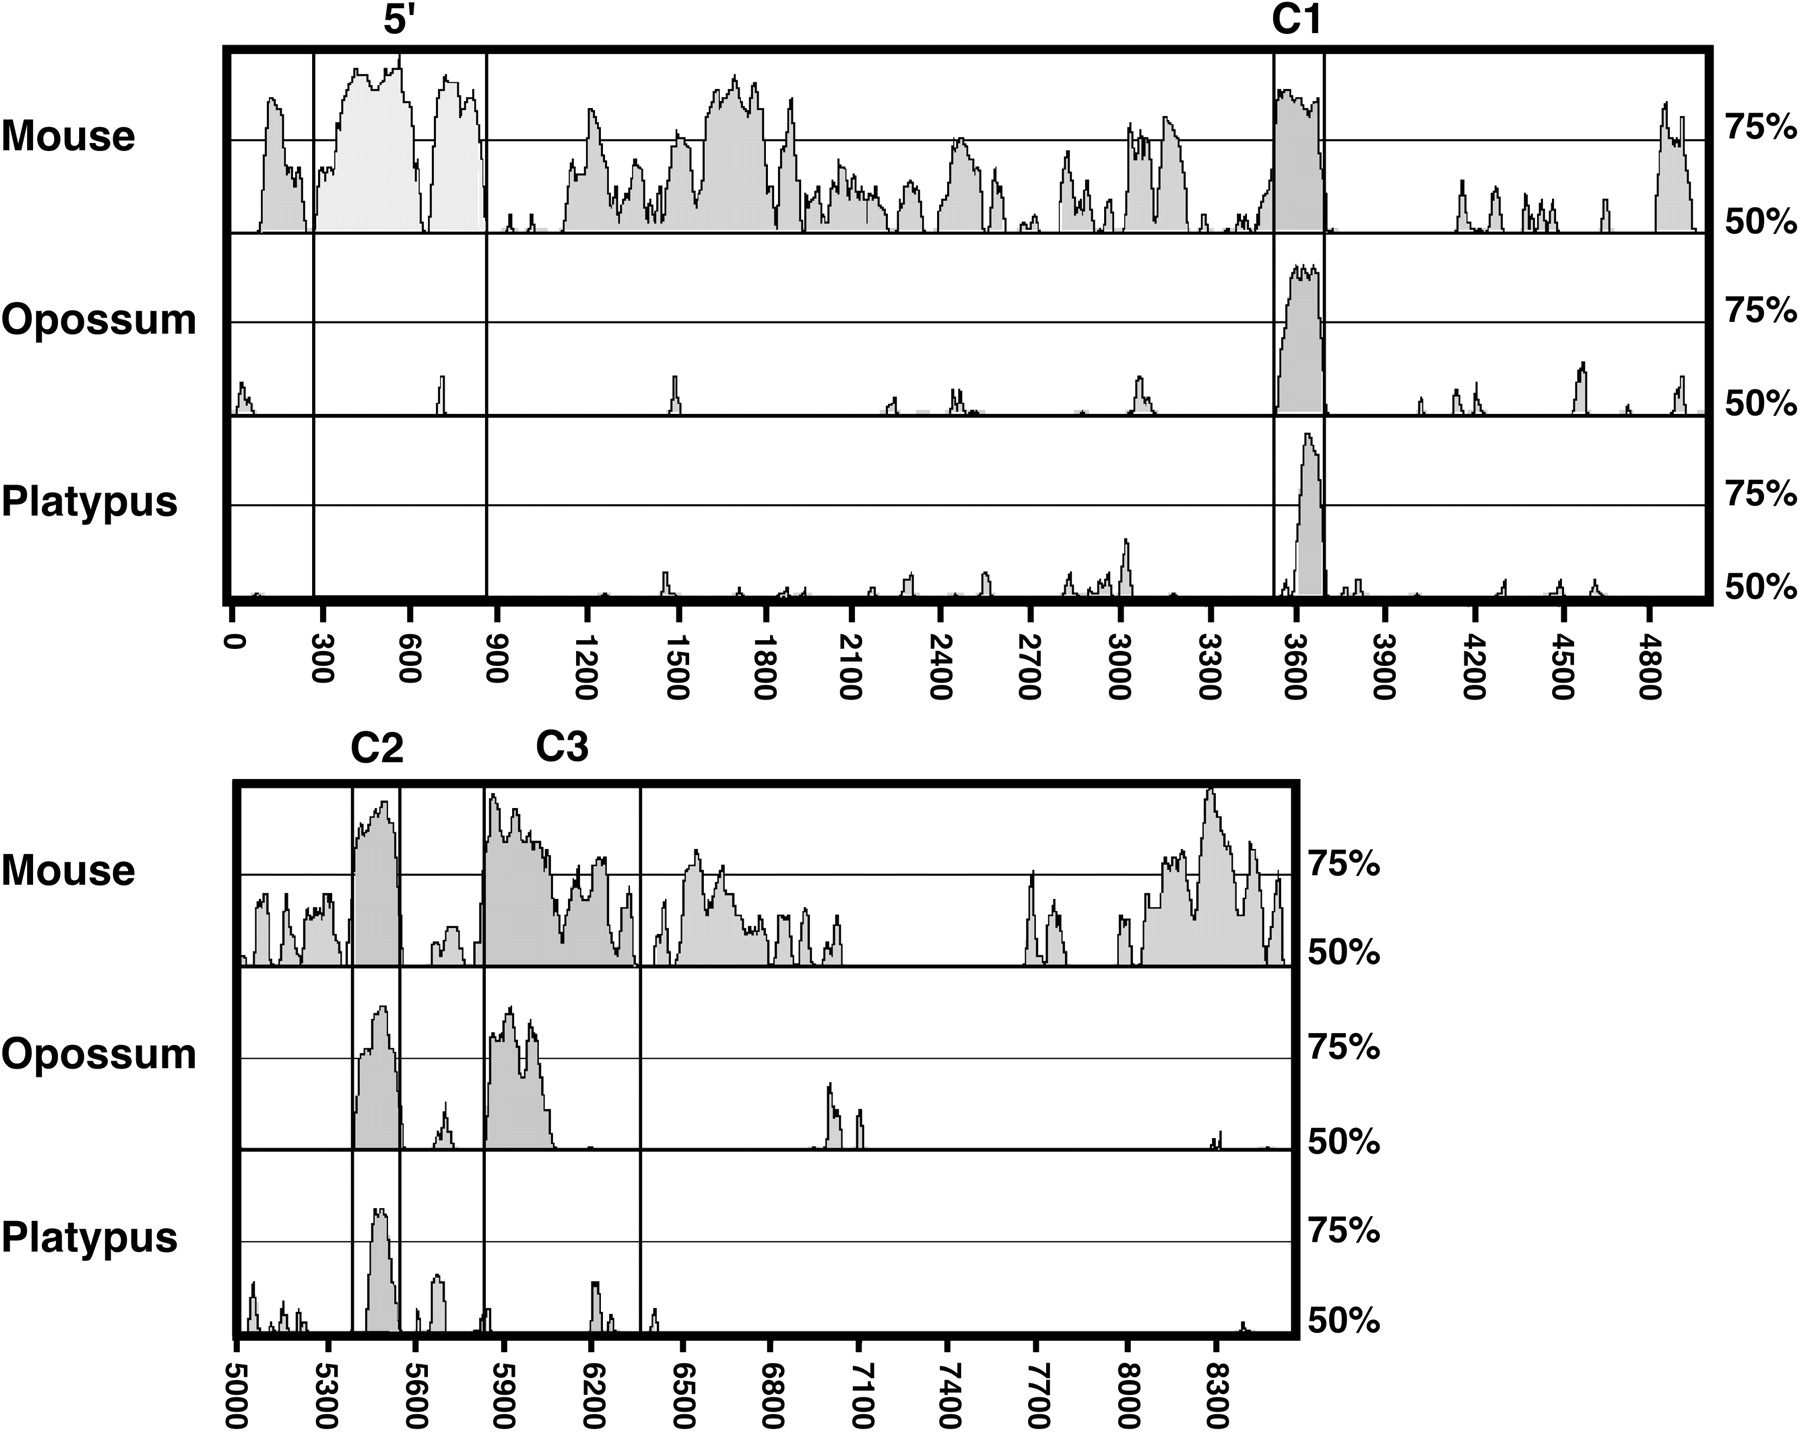
Figure 1
mVISTA plot of mouse, opossum, and platypus IGF2 sequences with respect to that of human. Conserved segments are defined as regions in which every contiguous subsegment of 50 bp was at least 50% identical to its paired sequence. These segments were then merged to define the conserved regions (shaded peaks). The x-axis denotes the nucleotide positions for the human IGF2 domain sequence, where position 1 corresponds to position 2399 of GenBank accession no. AF517226. Exons are delineated by boxes.


