
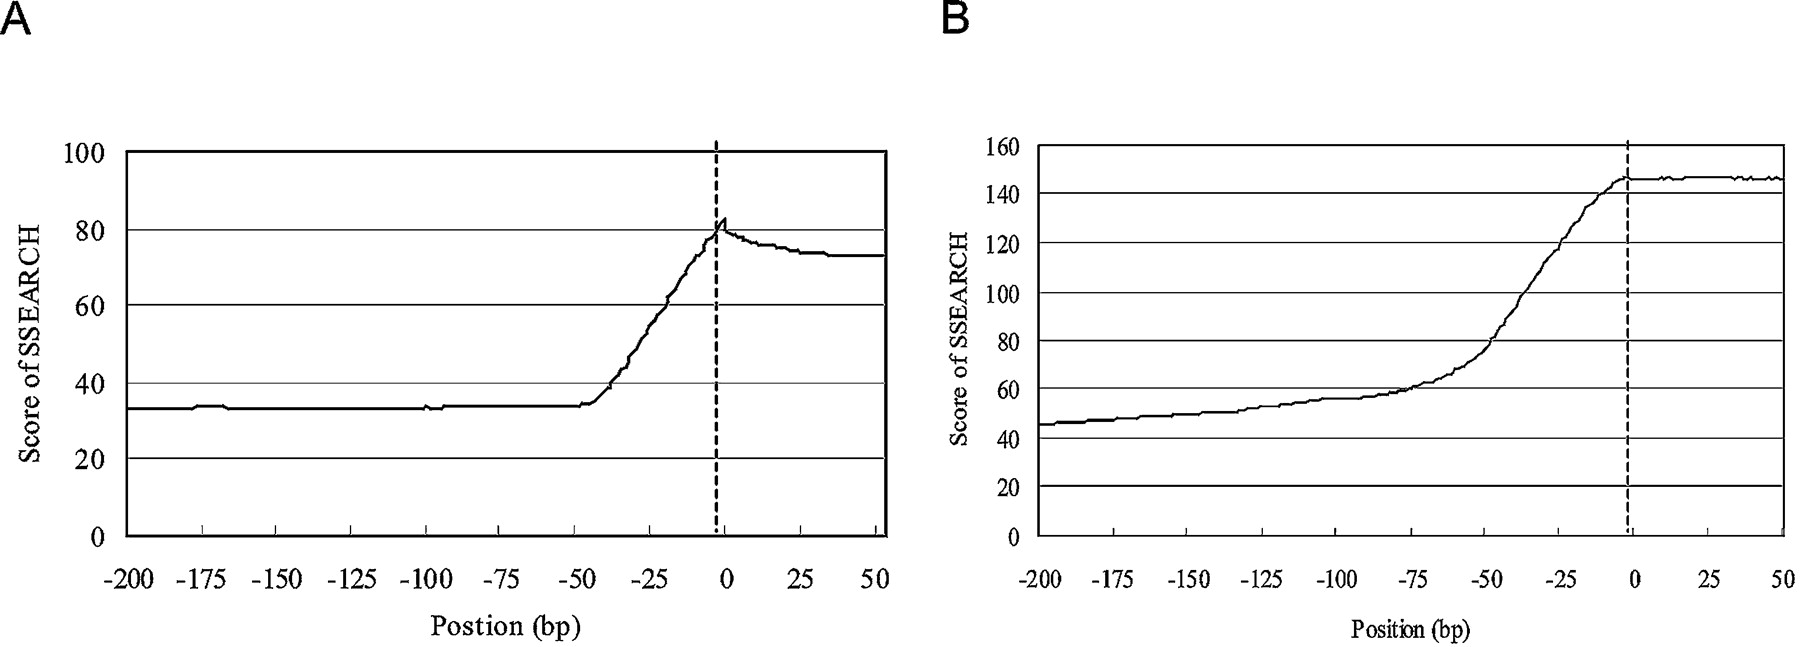
Sequence alignments around the boundary of the block and that of the first intron and the second exon using SSEARCH. (A) Sequences of human and mouse PPRs were aligned using SSEARCH with a 50-bp moving window around the boundary of the block. The broken line represents the boundary of the block calculated using LALIGN. The vertical axis represents the average score of the SSEARCH calculated for the corresponding position. The horizontal axis represents the relative position to the boundary. (B) Result of an analysis similar to that shown in A, using the proximal sequences of the 5′ end of the second exons. The broken line represents the exon-intron boundary. The horizontal axis represents the relative position to the exon-intron boundary.


