
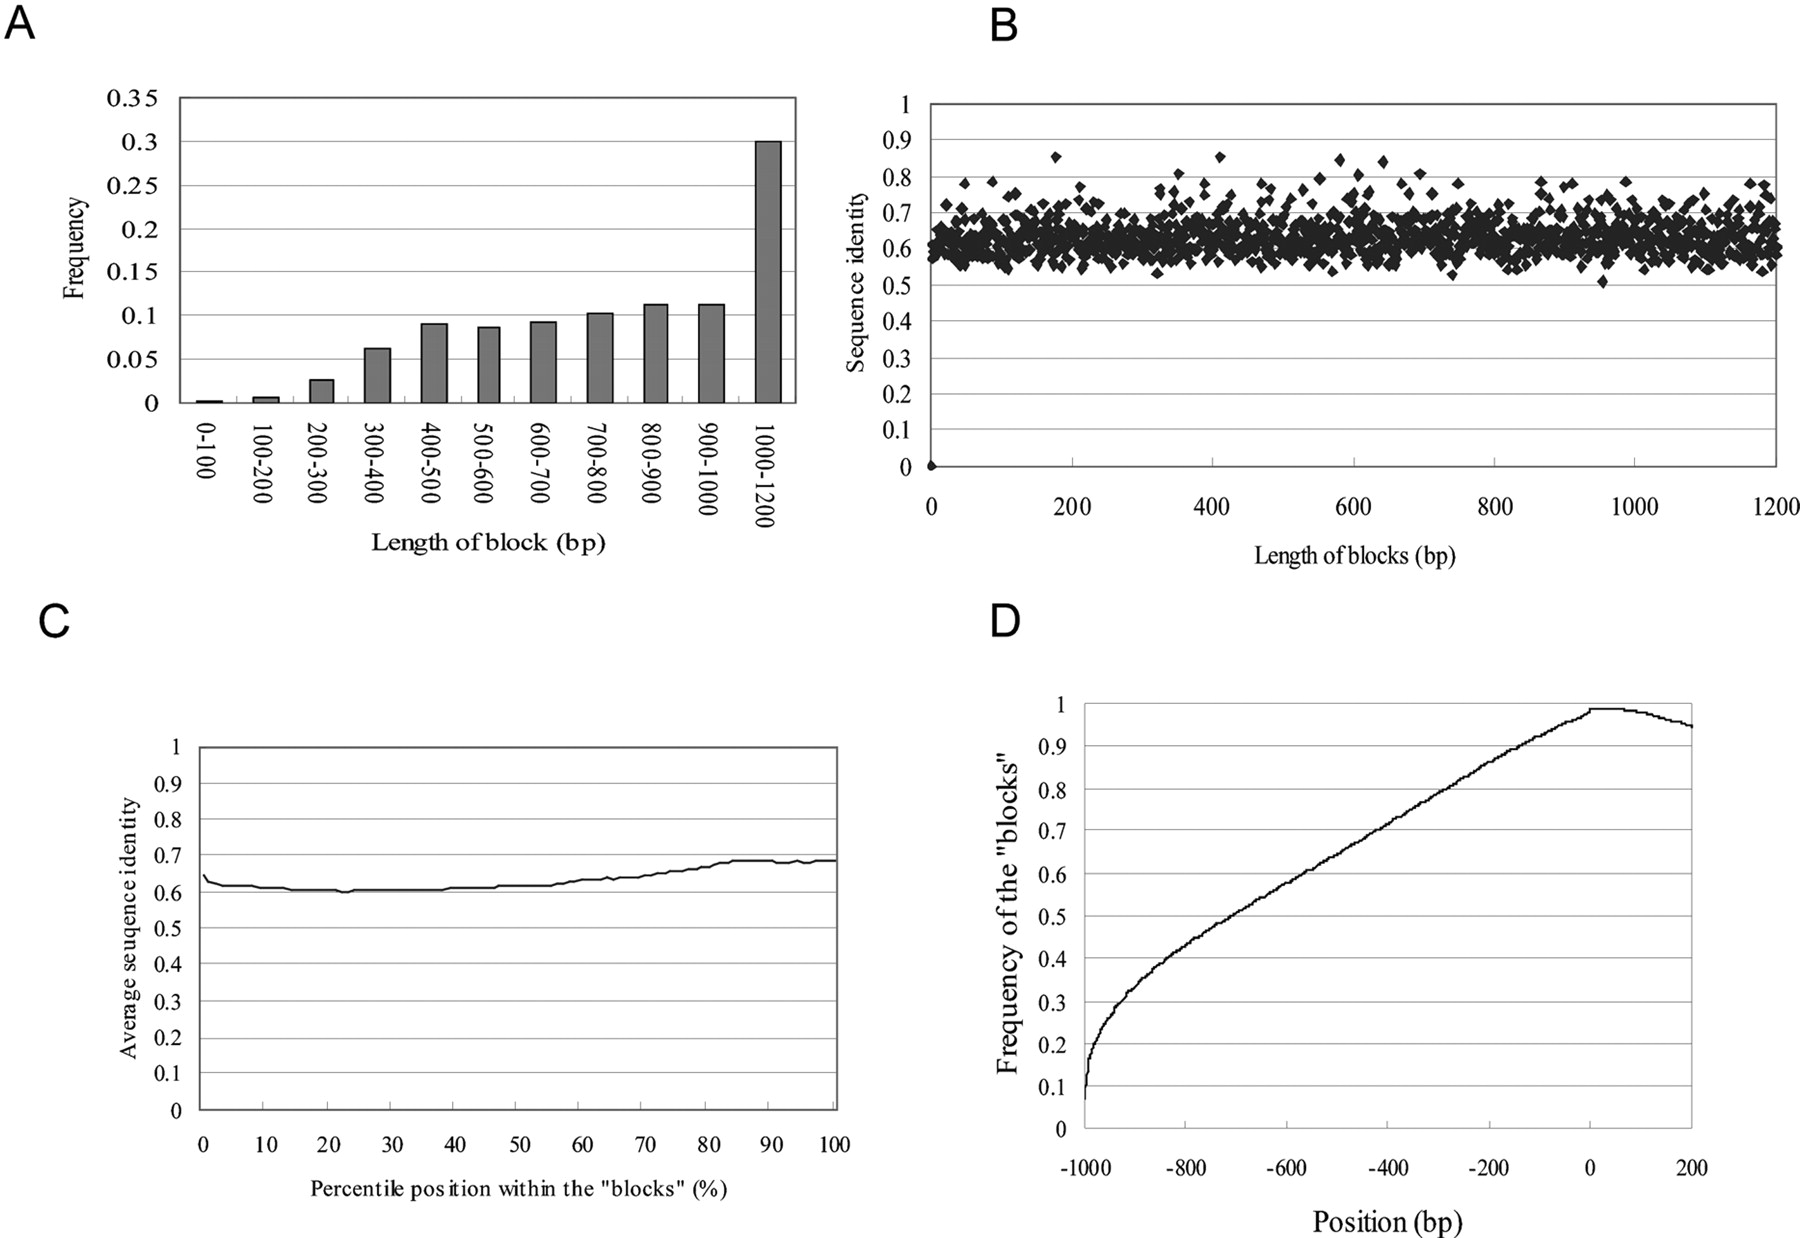
Sequence alignments of the block structure in PPRs and nongenic regions. (A) Frequency of the blocks belonging to each population is shown. (B) Relation between length of the block and the average sequence identity within it. (C) Relation between percentile position within the block and the average sequence identity. (D) Alignment of the nongenic sequences using LALIGN. The sequences ranging from -1 kb to + 200 bp of the putative syntenic regions located in nongenic regions as in UCSC genome browser were aligned and the frequencies of the aligned nucleotides were calculated at each of the positions. Vertical line represents the frequency of the nucleotide at the indicated position being located within the block. (Note that the vertical axis in Figure 1 represents the frequency of the sequence “identity”).


