
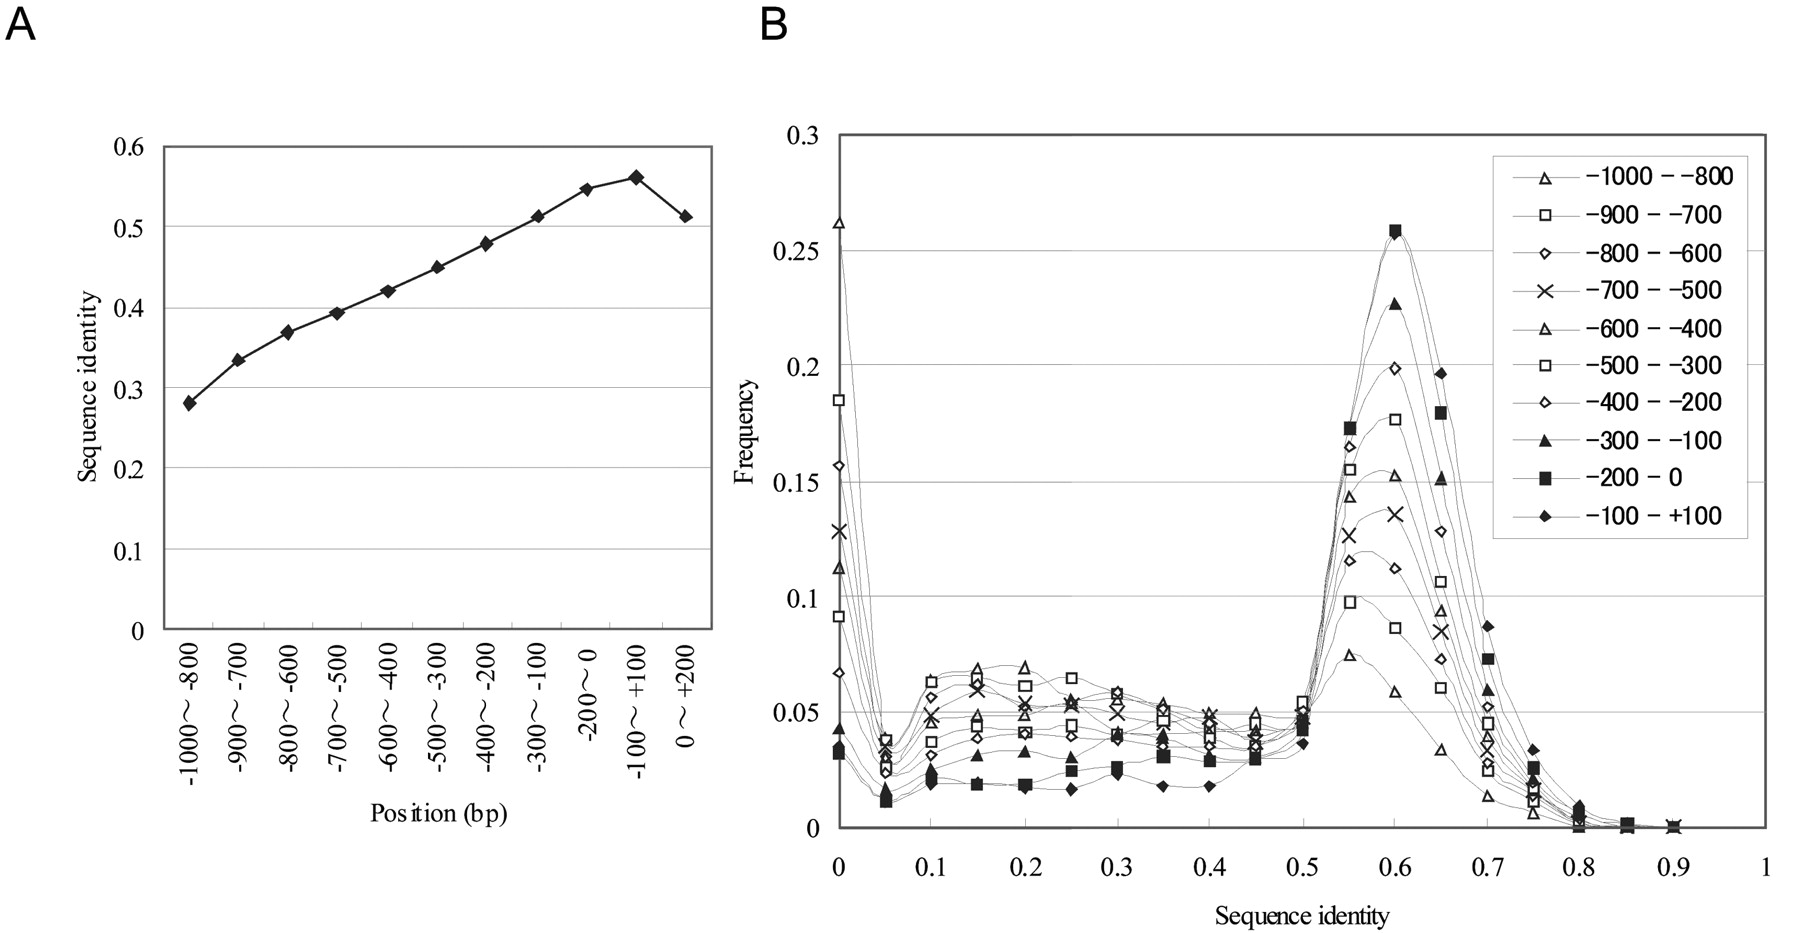
Figure 1
Sequence identity between human and mouse PPRs. Sequence alignments were calculated using LALIGN with the default parameters. The sequence identity was evaluated as the number of aligned nucleotides in the regions of -1000 to +200 (TSS: 0). The average sequence identities were calculated for each region (A). (B) The PPRs were separated into the 200-bp windows at the positions indicated in the inset. Sequence identity was calculated for each of the windows. Frequency as to which of the windows belong to which of the sequence identity groups represented on the horizontal axis is plotted.


