
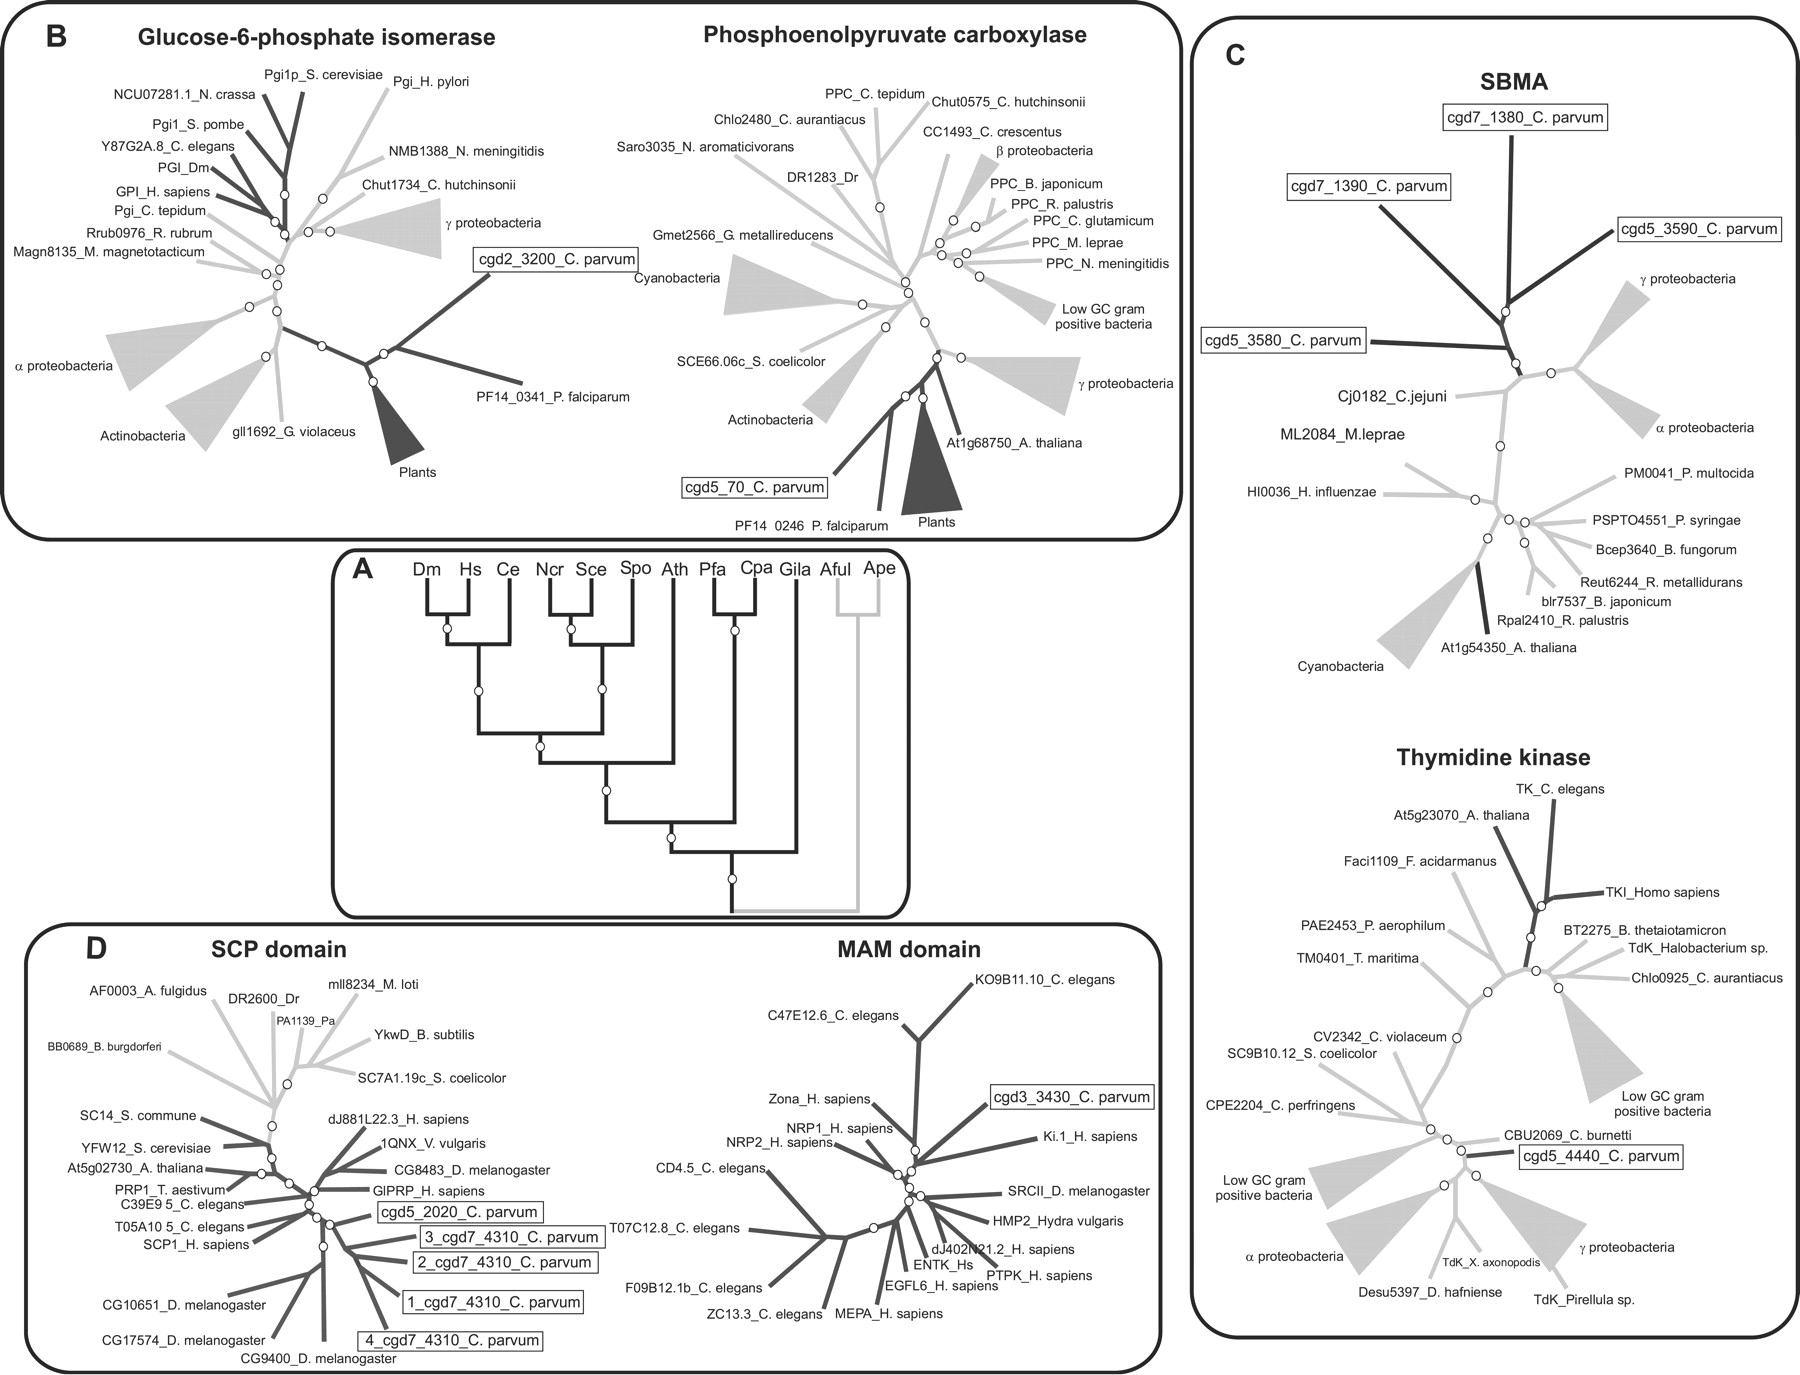
(A) Higher-order relationships between eukaryotes (having complete genome sequence information) rooted with archaeal orthologs, as inferred from a concatenated alignment of 30 highly conserved proteins. The circles indicate bootstrap supports >85% (or Bayesian posterior probability > 0.9) obtained by the full ML (Proml), Puzzle ML, weighted neighbor-joining, parsimony, and minimum evolution methods. Bacterial and archaeal branches are in gray and eukaryotic branches are in black. (B) Plant affinities of apicomplexan proteins, glucose-6-phosphate isomerase, and phosphoenolpyruvate carboxylase. (C) Bacterial affinities of apicomplexan proteins, SBMA and thymidine kinase. (D) Animal affinities of apicomplexan proteins, SCP and MAM-domain-containing proteins. In these cases, the circles indicate boostrap support >85% by ML distance analysis (with Puzzle), RellBP, and neighbor-joining methods. Proteins are represented by their gene names and specific names. Some are abbreviated for convenience. Species abbreviations are: (Afu) Archaeoglobus fulgidus; (Ape) Aeropyrum pernix; (Ath) Arabidopsis thaliana; (Bb) Borrelia burgdorferi; (Ce) Caenorhabditis elegans; (Cpa) Cryptosporidium parvum; (Dm) Drosophila melanogaster; (Dr) Deinococcus radiodurans; (Gila) Giardia lambia; (Hs) Homo sapiens; (Pa) Pseudomonas aeruginosa; (Pfa) Plasmodium falciparum; (Sce) Saccharomyces cerevisiae; (Spo) Schizosaccharomyces pombe.


