
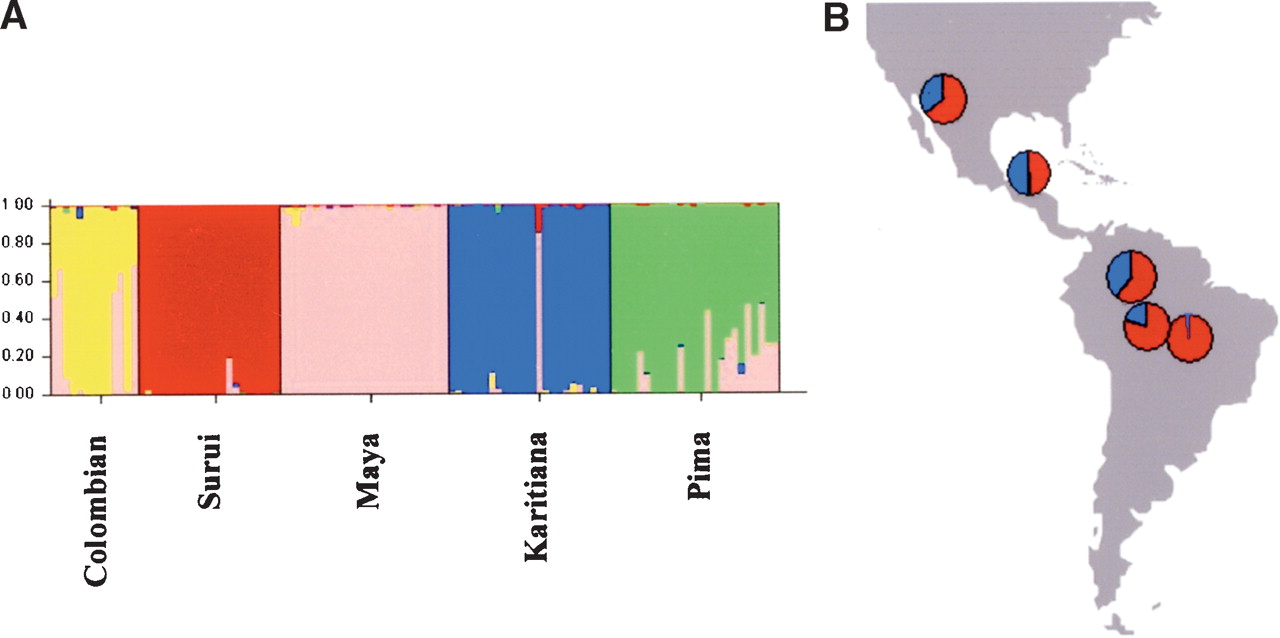
Figure 4
Assignment of Native American individuals using (A) correlated allele frequencies as used in Rosenberg et al. (2002) and (B) uncorrelated allele frequencies. In B, the assignment of the individuals has been determined using all individuals from the first subsample and four inferred populations as in Figure 2. In A, each bar represents a single individual, and the colors correspond to the coefficients of ancestry. In B, the coefficients of ancestry were averaged over the five individuals for each population. Blue and red segments represent the proportion of ancestry in inferred population B and D, respectively.


