
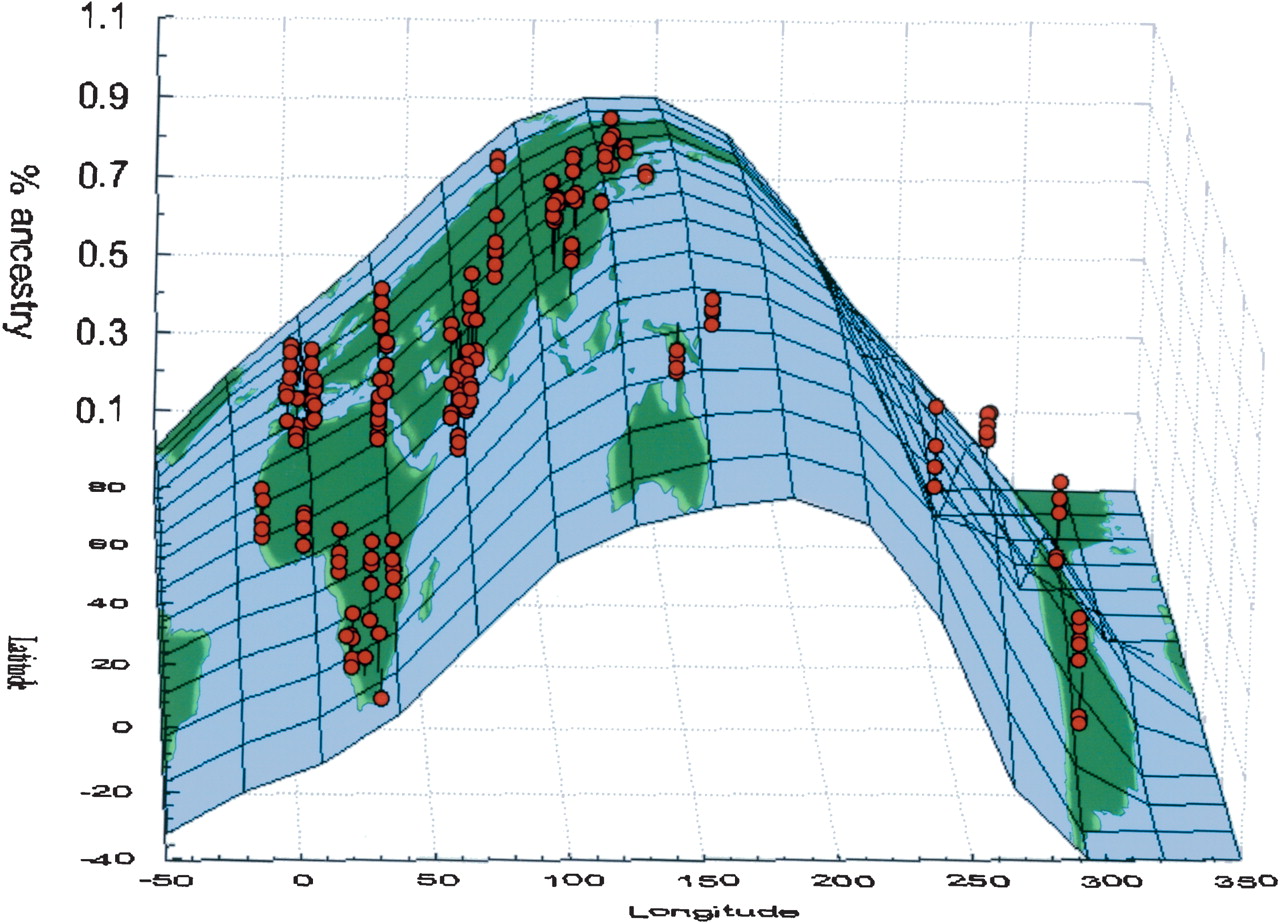
Figure 3
Geographic representation of the proportion of ancestry in inferred population B obtained by Structure. Red dots represent individuals defined by their longitude (x-axis), latitude (y-axis), and coefficient of ancestry (z-axis) in the inferred population B. The surface of the world was fitted to the xyz coordinates using a distance weighted least-squares smoothing method.


