
Figure 2
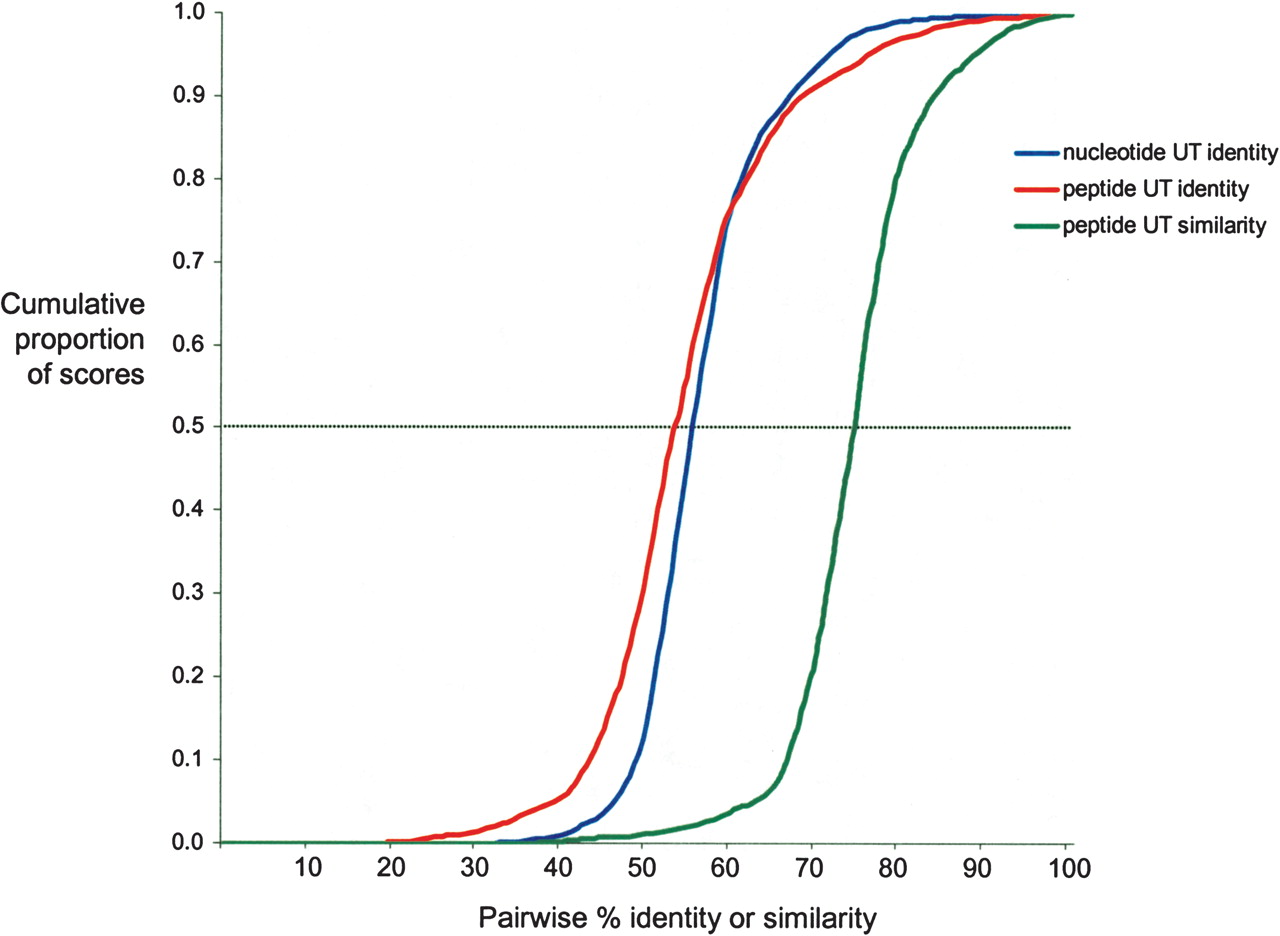
Cumulative frequency distribution plot of pairwise UT nucleotide sequence identity and pairwise UT peptide sequence identity and similarity for representatives of each of 247 bacterial and eukaryotic genera.
(Downloading may take up to 30 seconds. If the slide opens in your browser, select File -> Save As to save it.)
Click on image to view larger version.
Cumulative frequency distribution plot of pairwise UT nucleotide sequence identity and pairwise UT peptide sequence identity and similarity for representatives of each of 247 bacterial and eukaryotic genera.
 CiteULike
 Delicious
 Digg
Digg Facebook
 Google+
 Reddit
 Twitter
