
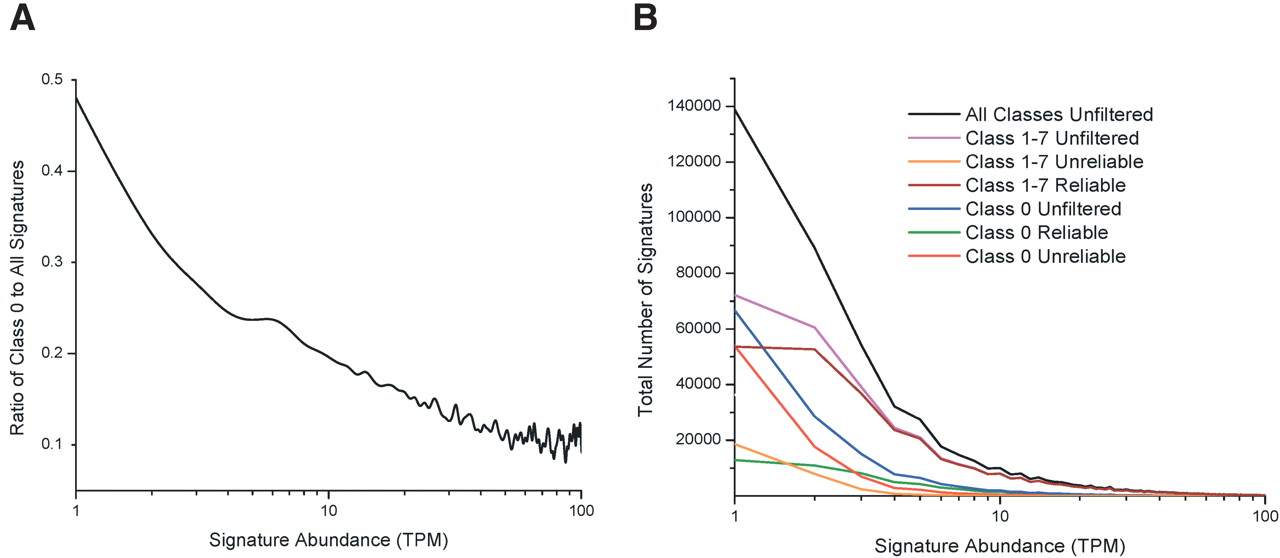
MPSS expression levels and reliability of signatures not matched to the genome. (A) The ratio was calculated as the number of distinct Class 0 signatures to the number of all expressed signatures, with no filters applied. The number of signatures in each group was calculated by joining data across all 14 libraries. The x-axis indicates each level of abundance, in TPM, for the signatures that were compared. The y-axis indicates the ratio of the two frequency counts. The x-axis is shown in logarithmic scale because the majority of the signatures are found at low abundance levels; likewise, this axis ends at 100 TPM because only a small percentage of the signatures are found above this level. (B) For each abundance level indicated on the x-axis, the number of distinct signatures is indicated on the y-axis. The data from all 14 libraries were considered together. The black line indicates the abundance levels for all 268,132 distinct signatures (no filters applied). The following colored lines correspond to each group of Class 1 to 7 signatures: (cyan line) unfiltered; (orange line) “unreliable” signatures; (brown line) “reliable” signatures. The following colored lines correspond to each group of Class 0 signatures: (blue line) unfiltered; (red line) “unreliable” signatures; (green line) “reliable” signatures.


