
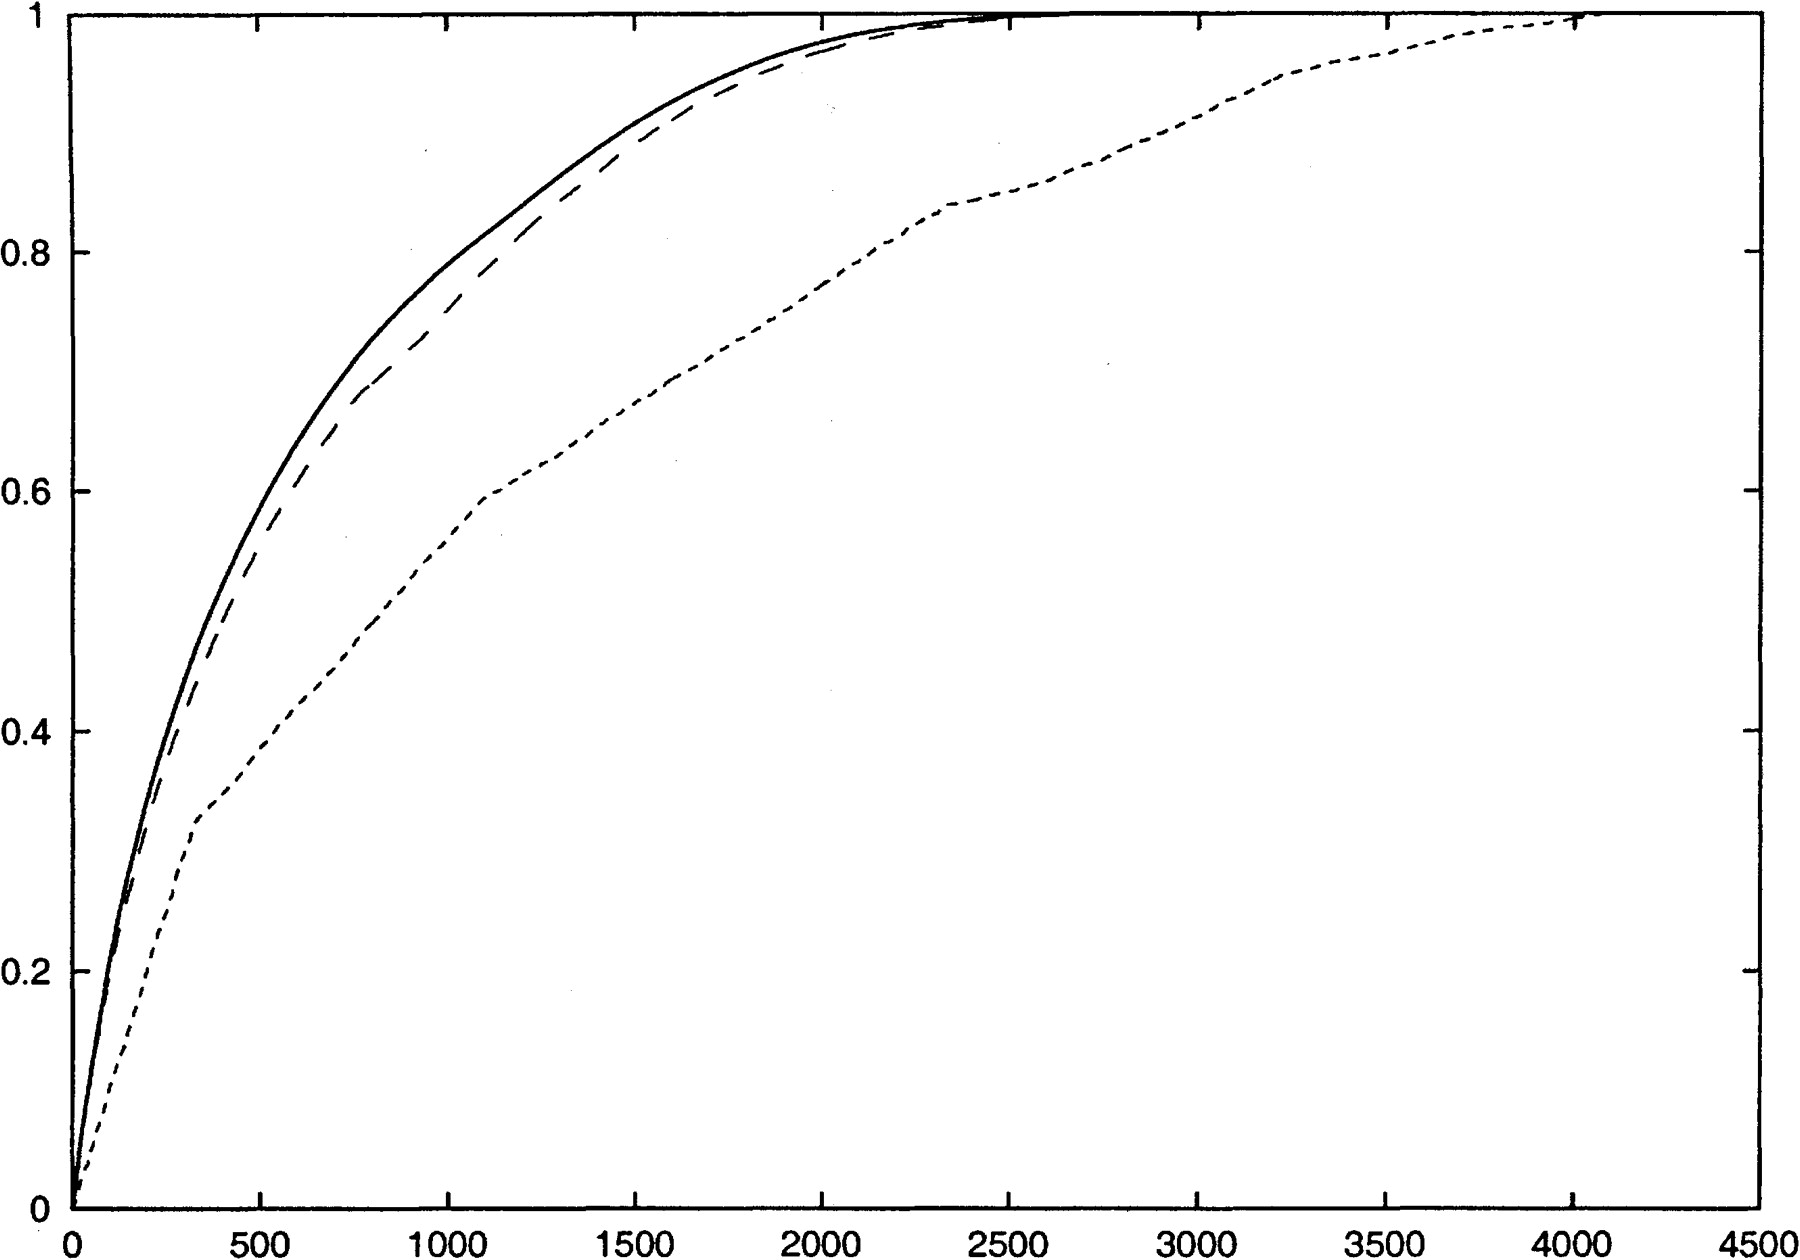
Figure 7
The effects of changing the quality function being optimized on the Chromosome 22 Caucasian genotype data set. The x-axis represents the number of SNPs genotyped, and the y-axis shows the fraction of haplotype r2 captured. The solid line shows the haplotype r2 if tagging SNPs are chosen optimally, the dashed line shows the haplotype r2 if the tagging SNPs are selected by maximizing haplotype informativeness, and the dotted line shows the informativeness from choosing random sets of tagging SNPs.


