
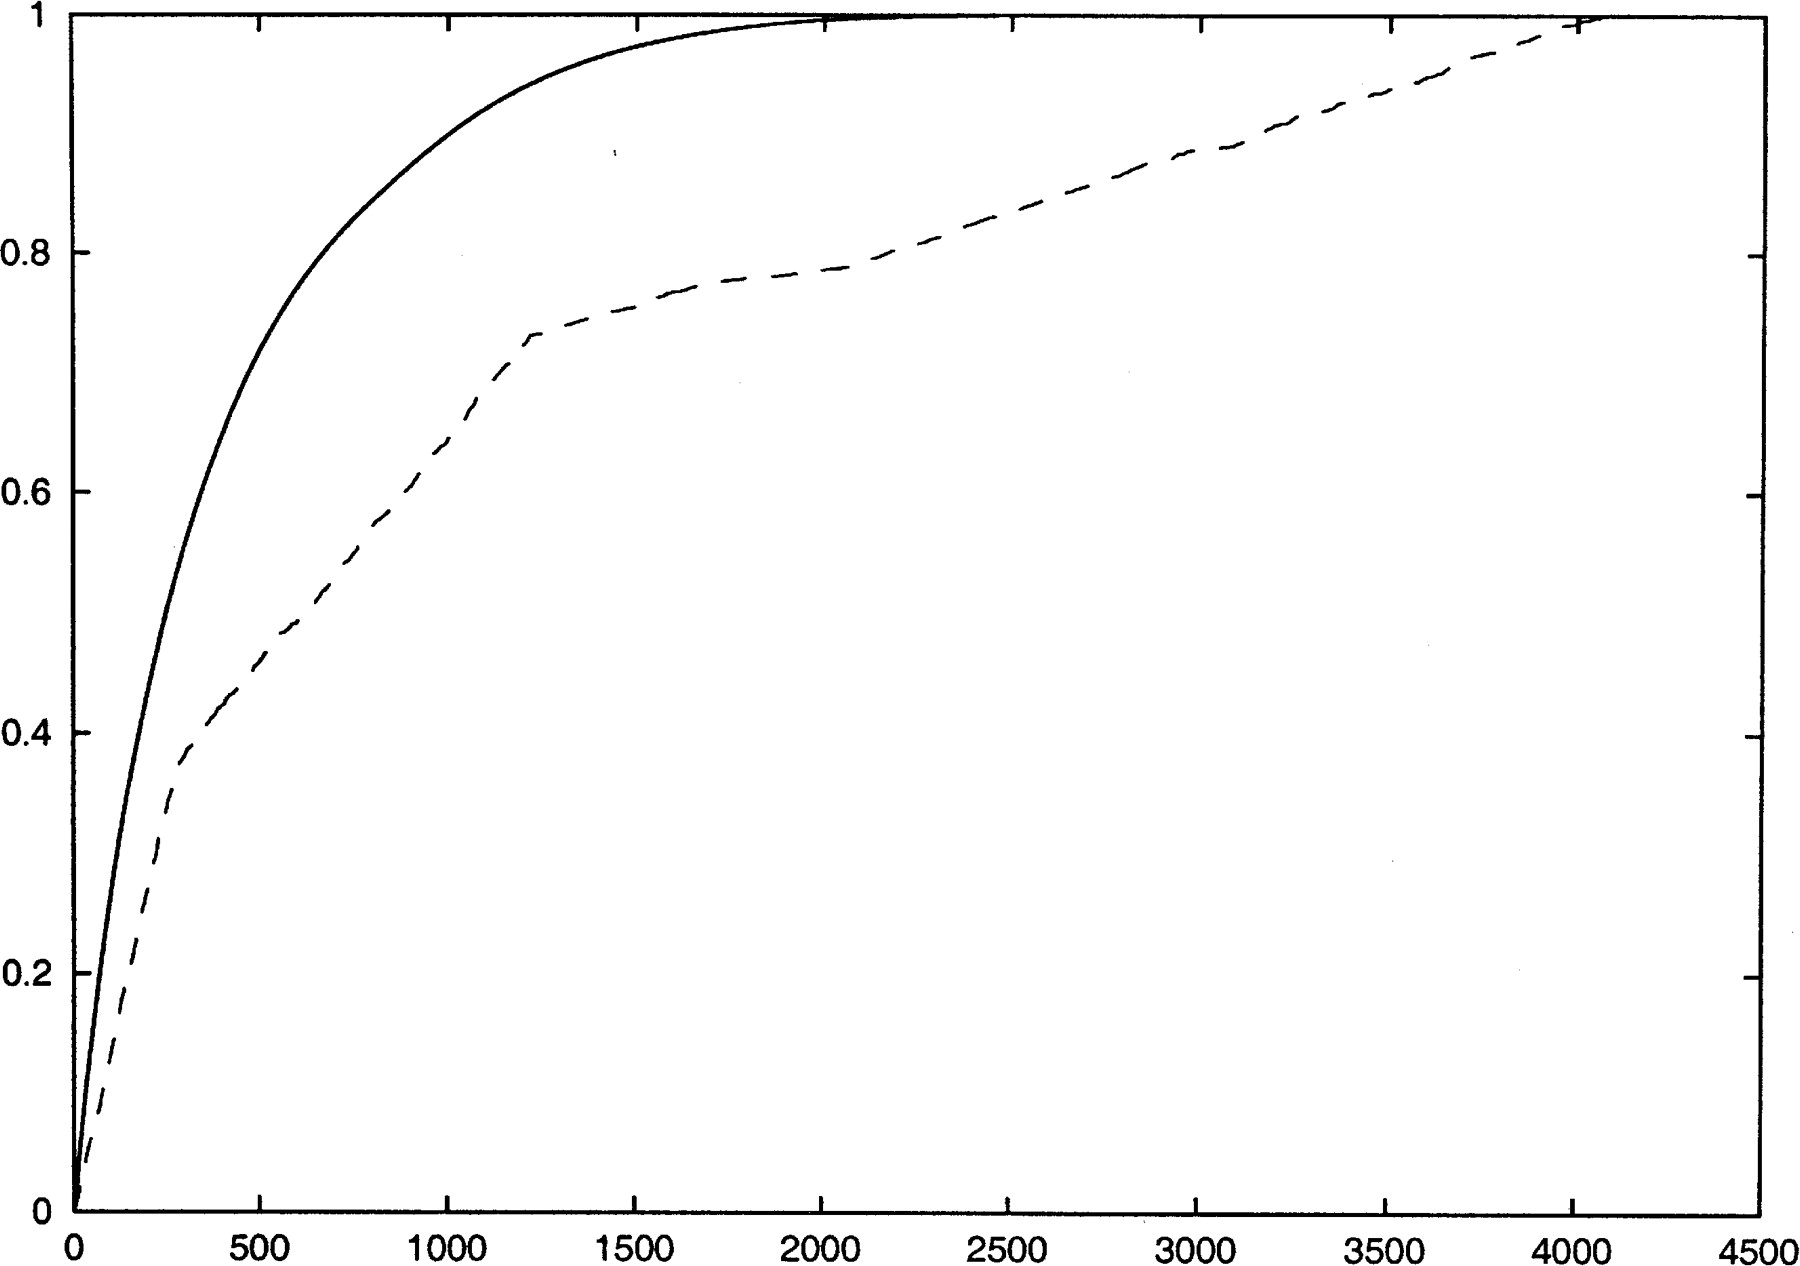
Figure 6
The x-axis shows the number of SNPs genotyped and the y-axis the fraction of the informativeness captured by those SNPs. The upper (solid) line represents the optimal solution and the lower (dashed) line a random solution. Computations are done for the Chromosome 22 Caucasian genotype data set.


