
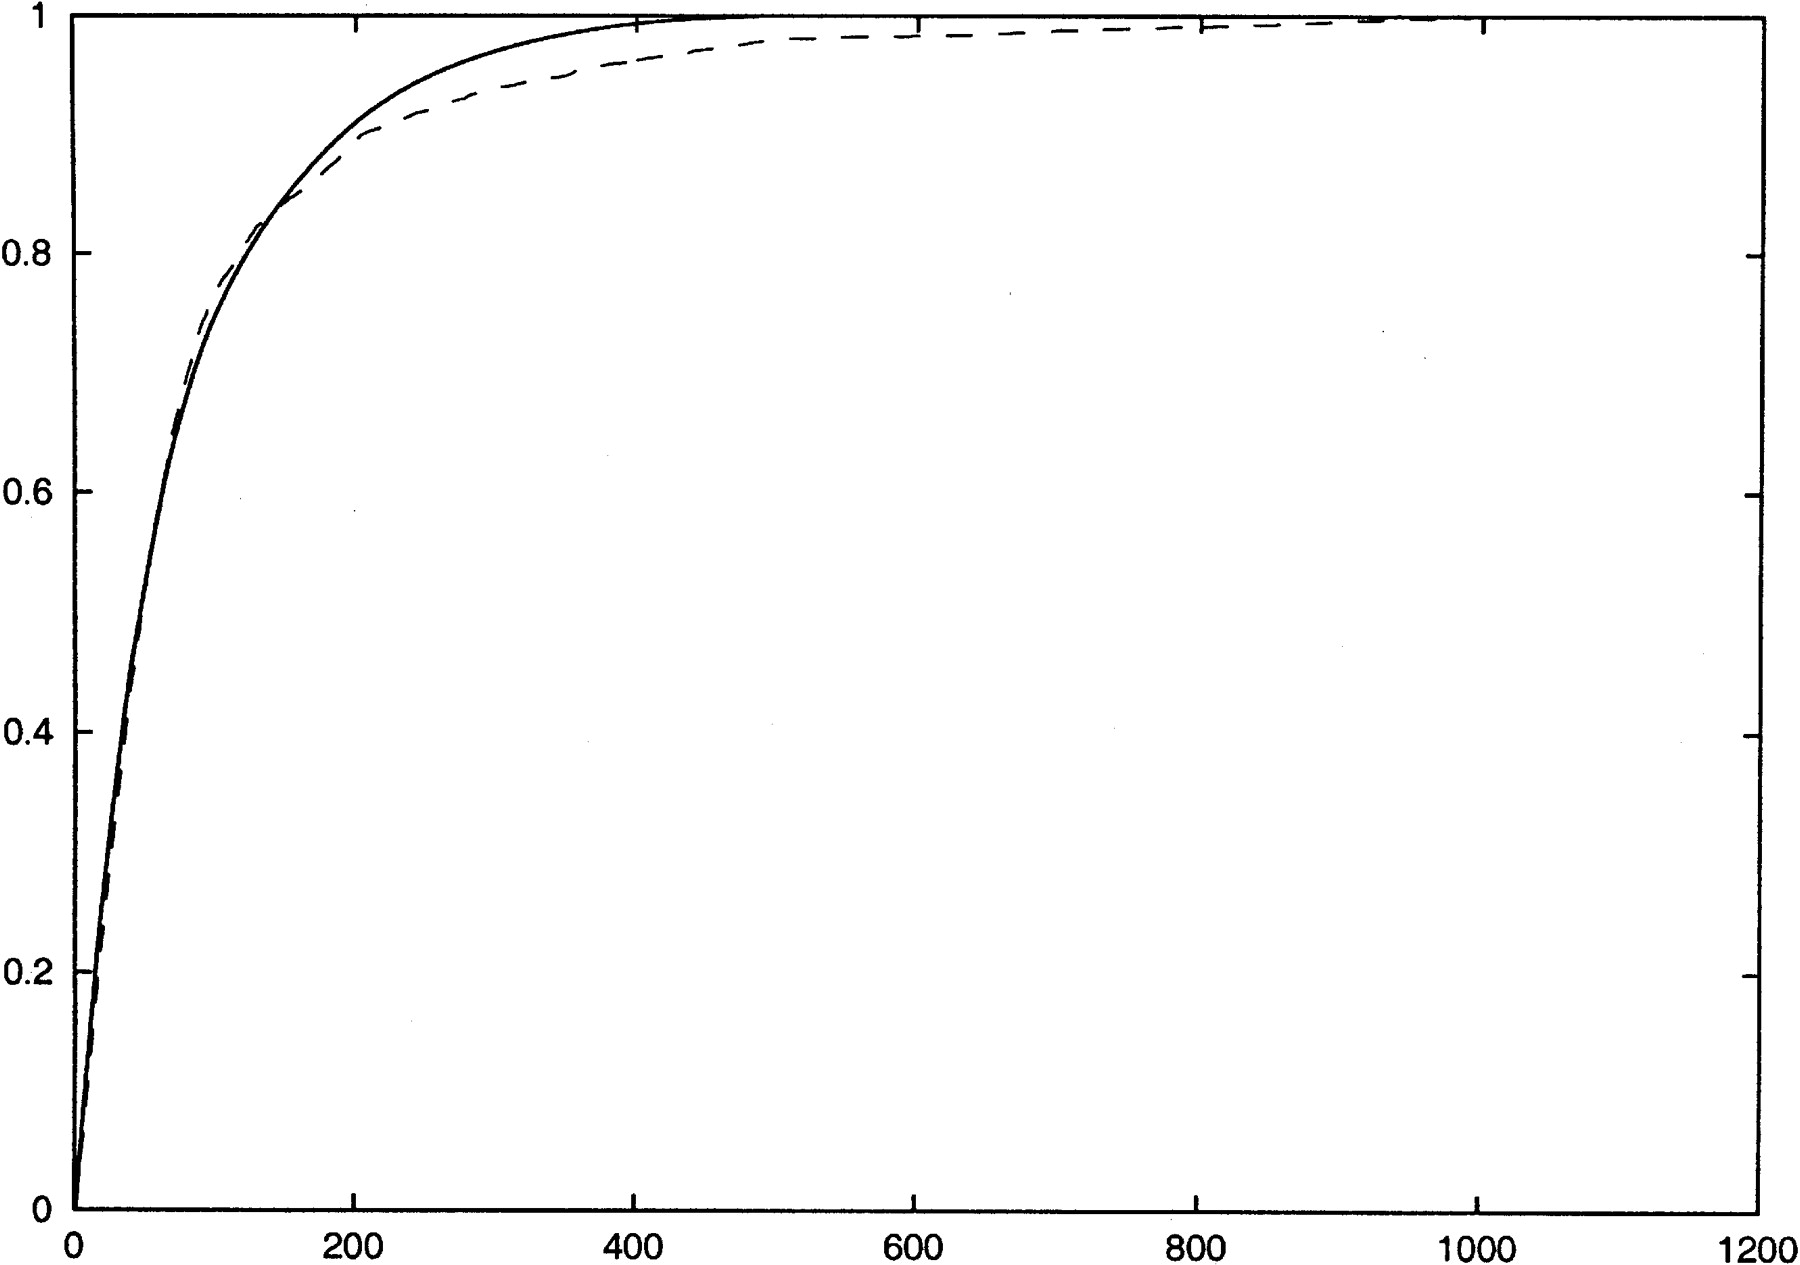
Figure 4
The x-axis shows the number of SNPs typed, and the y-axis shows the fraction of total informativeness or total number of SNPs correctly imputed in a leave-one-out experiment. The solid (upper) curve represents informativeness and the dashed (lower) curve shows the fraction of SNPs that are correctly imputed in a leave-one-out experiment. The data set used is the first 1000 SNPs of the Chromosome 21 data set of Patil et al. (2001) using the no-four-gamete violation definition of blocks and neighborhoods. Neighborhoods were restricted to have sizes no larger than 13.


