
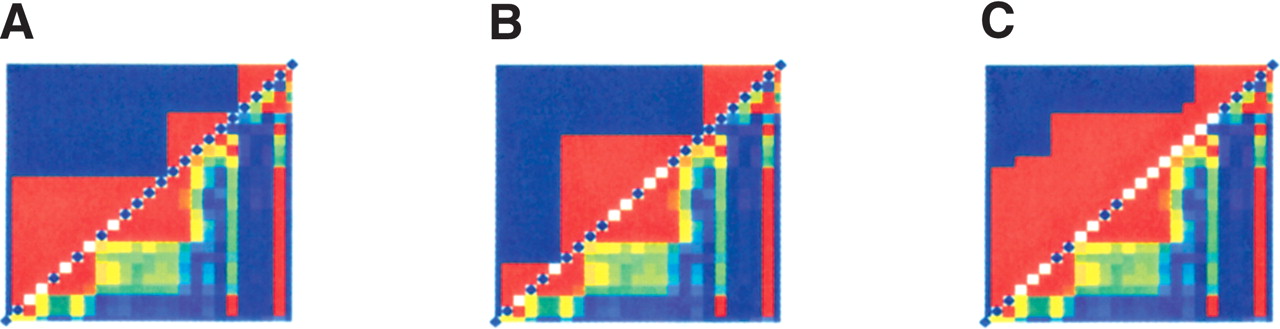
Figure 1
The three panels display a region of Chromosome 22. The lower triangle of each panel shows the LD between pairs of SNPs, where red denotes high LD and blue low LD. The upper triangles show the pairs of SNPs where one is used to predict the other. (A,B) The haplotype blocks as determined by two different runs of the block detection method of Gabriel et al. (2002). (C) The neighborhoods determined from taking the union of all possible Gabriel et al. blocks in the interval. The diamonds on the diagonal display the tagging SNPs selected for the three sets, using the algorithm of Zhang et al. (2003a) for the first two figures and the algorithm presented in this paper for the third figure.


