
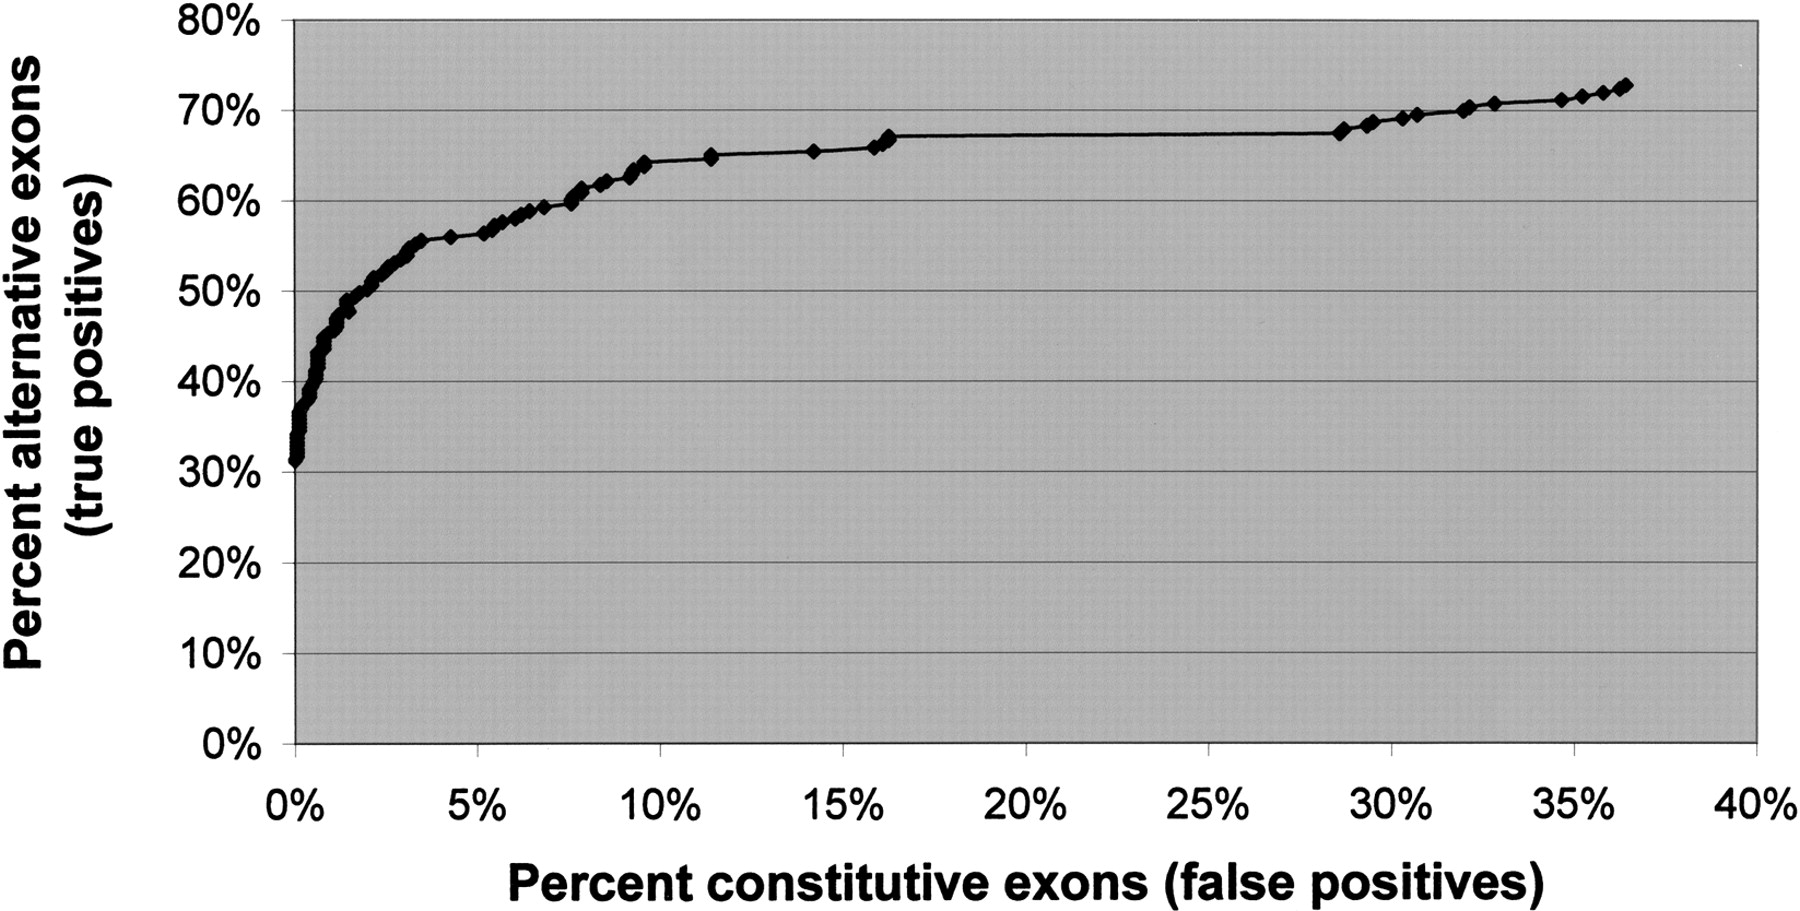
Figure 3
Sensitivity vs. false-positive rate in classification rules. Each square on the curve represents the performance of a single classification rule. x-axis, 1-specificity, i.e., percent constitutive exons (false positives) retrieved by the rule. y-axis, sensitivity, i.e., percent alternative exons (true positives) identified by the rule. Values were computed relative to the training set. Rules that were used for this plot are provided as Supplemental material.


