
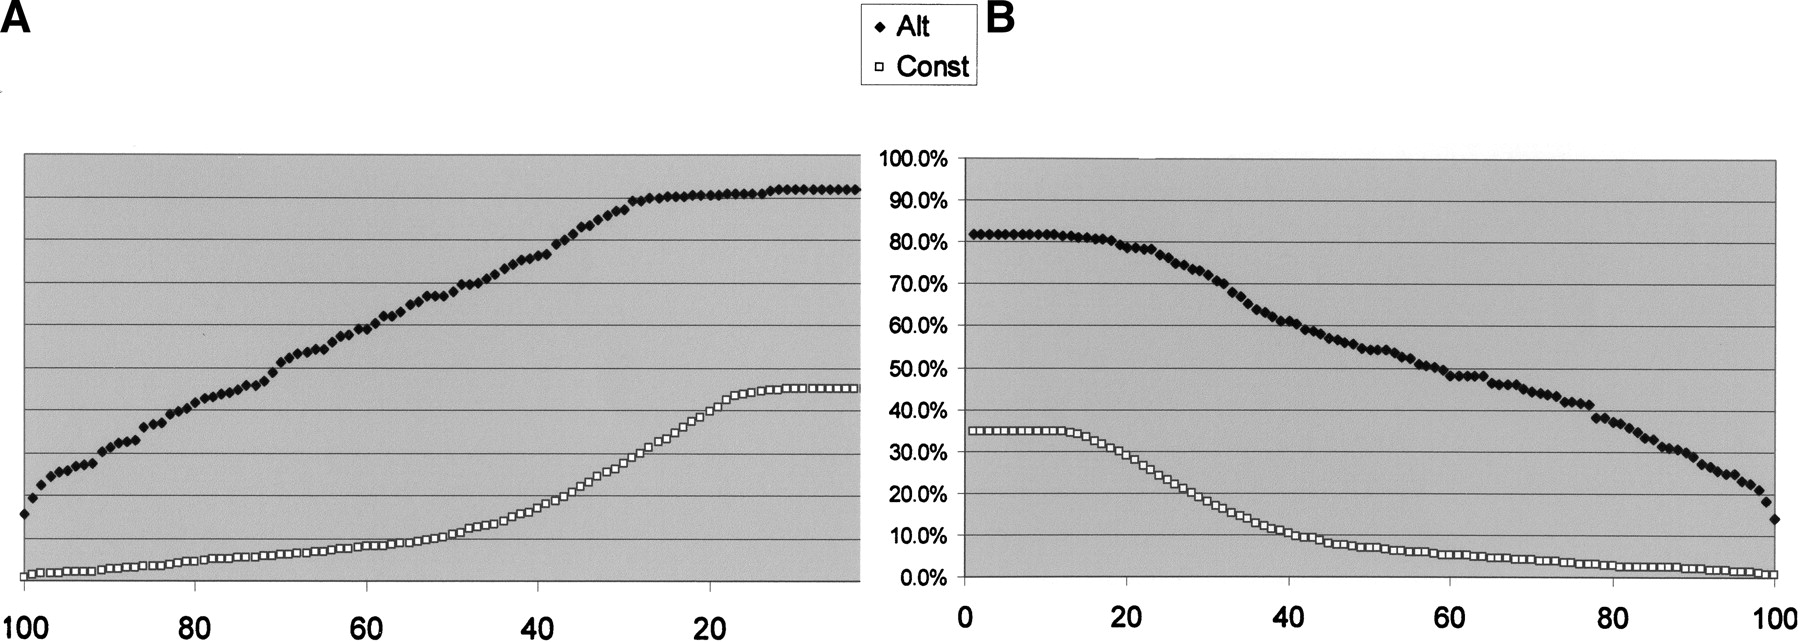
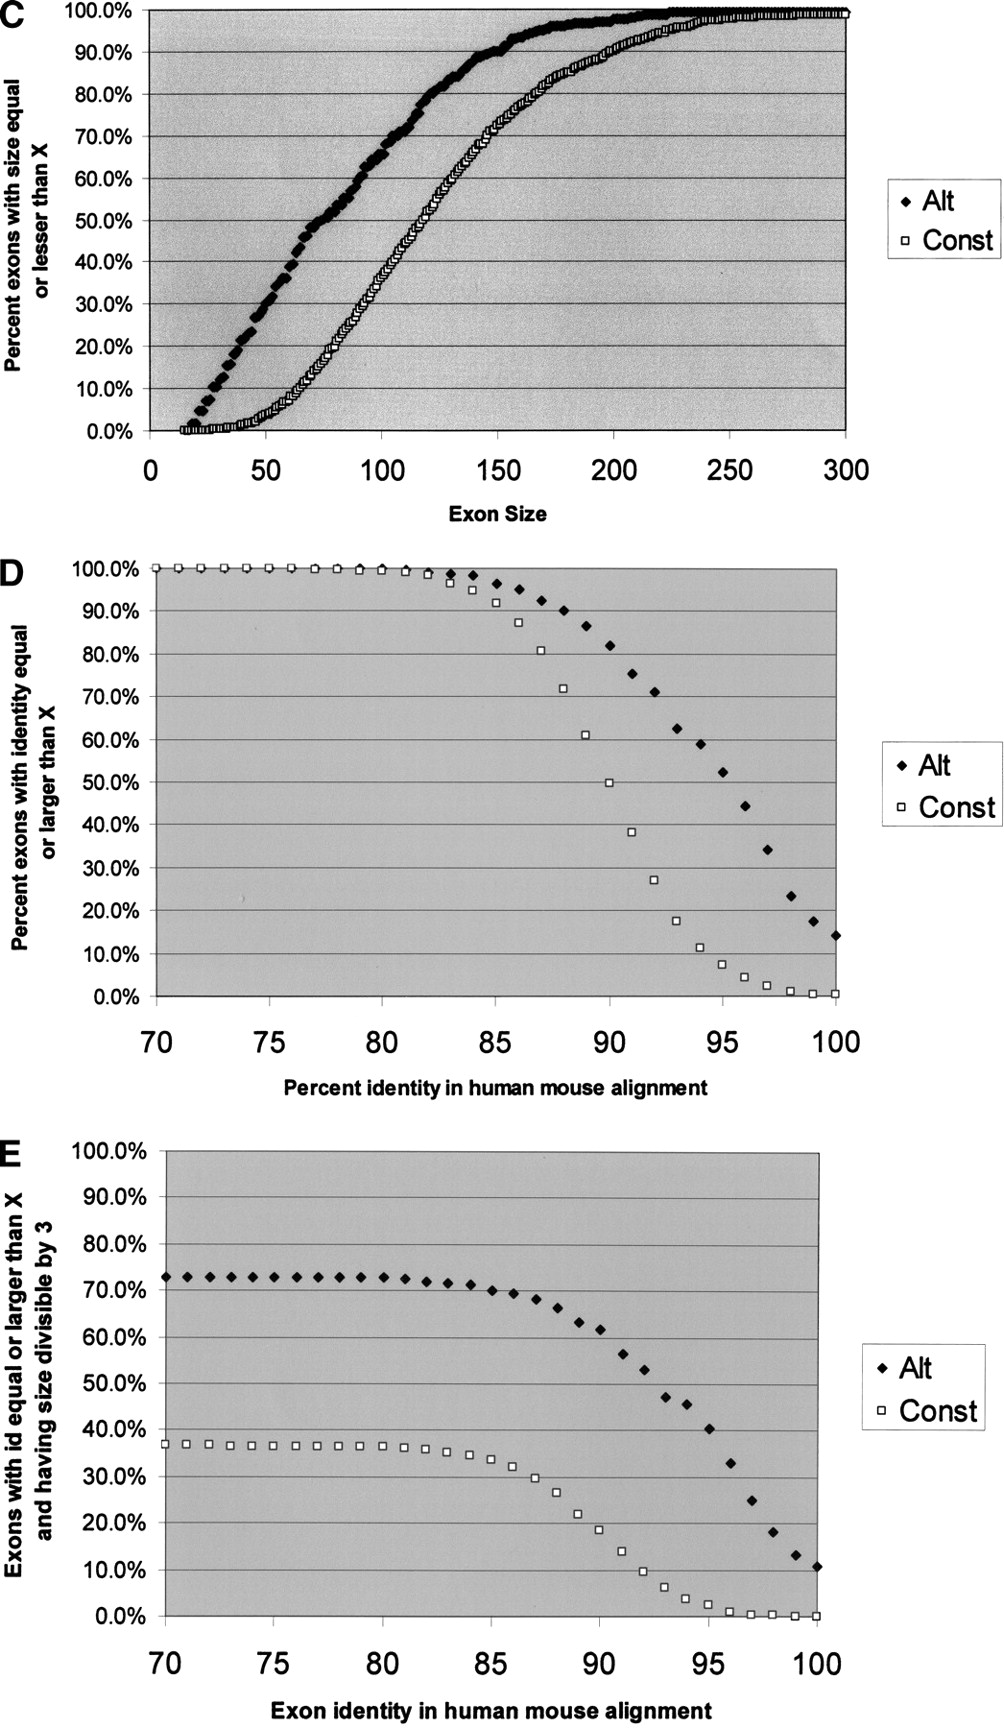
Graphic representation of the differences between alternative and constitutive exons. For each of the following curves, constitutive exons are in squares, and alternatives are in diamond shapes. (A) Length of conserved region in the nearest 100 nt of the flanking upstream intron. x-axis, length of conserved region (best Sim4 local alignment); y-axis, percent exons with upstream conserved region greater than or equal to the value in x. Conservation was detected using local alignment with the mouse 100 counterpart intronic nt. A minimum hit was 12 consecutive perfectly matching nt. (B) Length of conserved region in the nearest 100 nt of the flanking downstream intron. Axes as in A.(C) Exon size distribution. x-axis, exon size; y-axis, percent exons having size lesser or equal to the size in x. (D) Human–mouse exon identity. x-axis, percent identity in the global alignment of the human and the mouse exons; y-axis, percent exons with identity greater or equal to the value in x. (E) Human–mouse exon identity, for exons whose size is a multiple of 3. Axes as in D. Note that by combining two features we get better separation of the two exon-types.


