
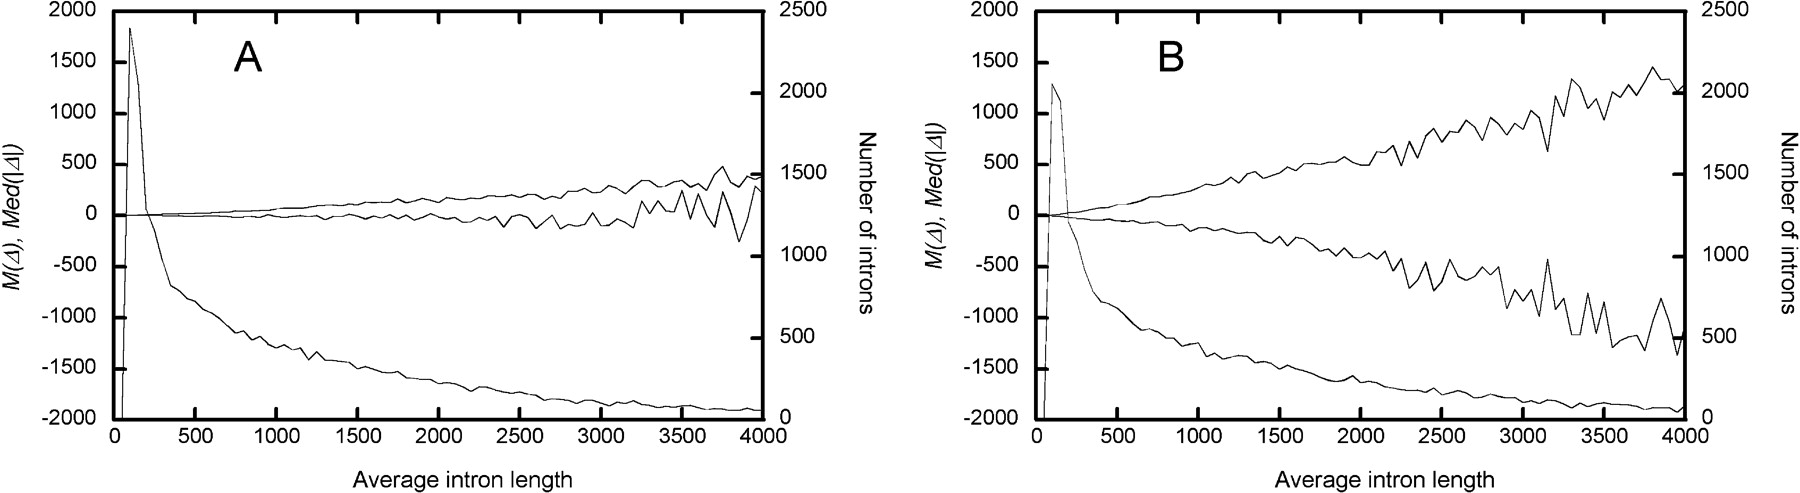
Figure 3
Properties of intron pairs as functions of their average length, L. Numbers of introns with different values of L (in bins of size 50), and the corresponding M(Δ) (decreasing lines) and Med(|Δ|) (increasing lines) are shown for rat–mouse (A) and mouse–human (B) intron pairs.


