
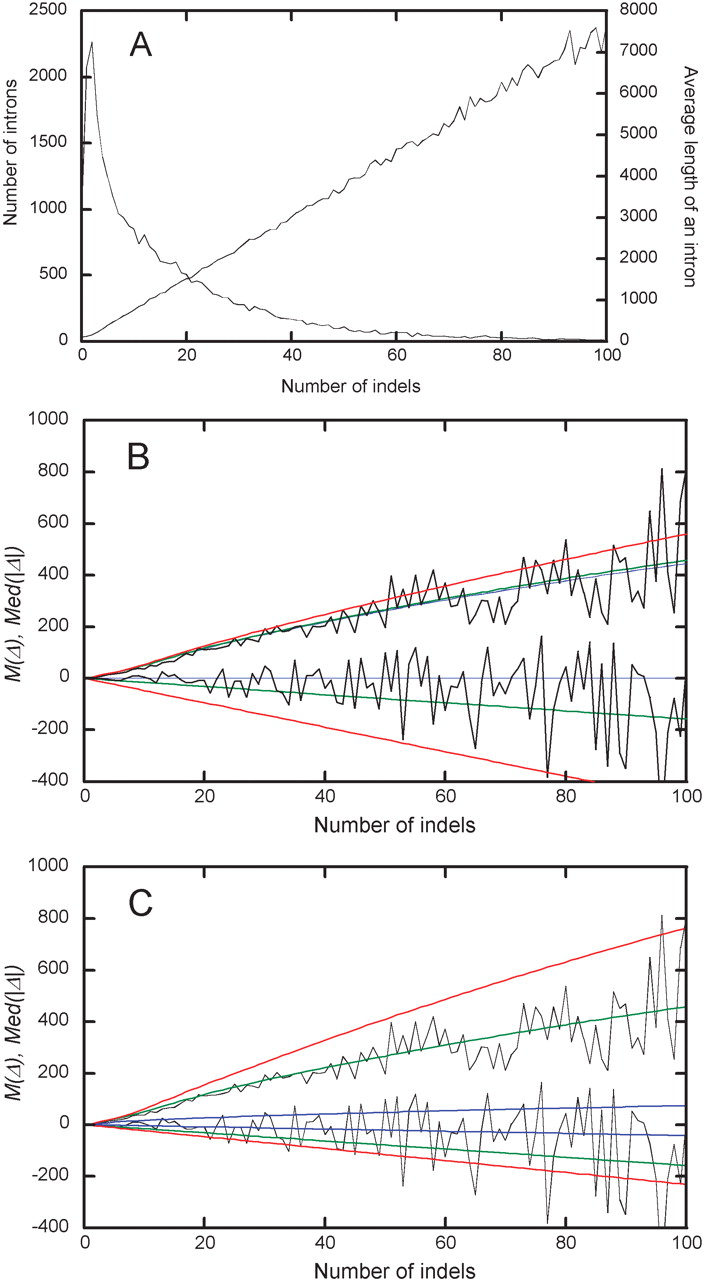
Figure 2
Data on rat–mouse pairs of orthologous introns with different numbers of accumulated indels, k. Numbers and average length L of intron pairs (A). Data on M(Δ) (decreasing lines) and Med(|Δ|) (increasing lines) in all intron alignments (rugged lines) compared with theoretical predictions (equation 1; smooth lines) obtained with a = 0.5 (blue lines), 0.46 (green lines), and 0.38 (red lines) under P(δ) (equation 7) for intron pairs with the average lengths between 150 and 2500 (B), or with P(δ) for intron pairs of average lengths >150 (blue lines), between 150 and 2500 (green lines), and <2500 (red lines) under a = 0.46 (C).


