
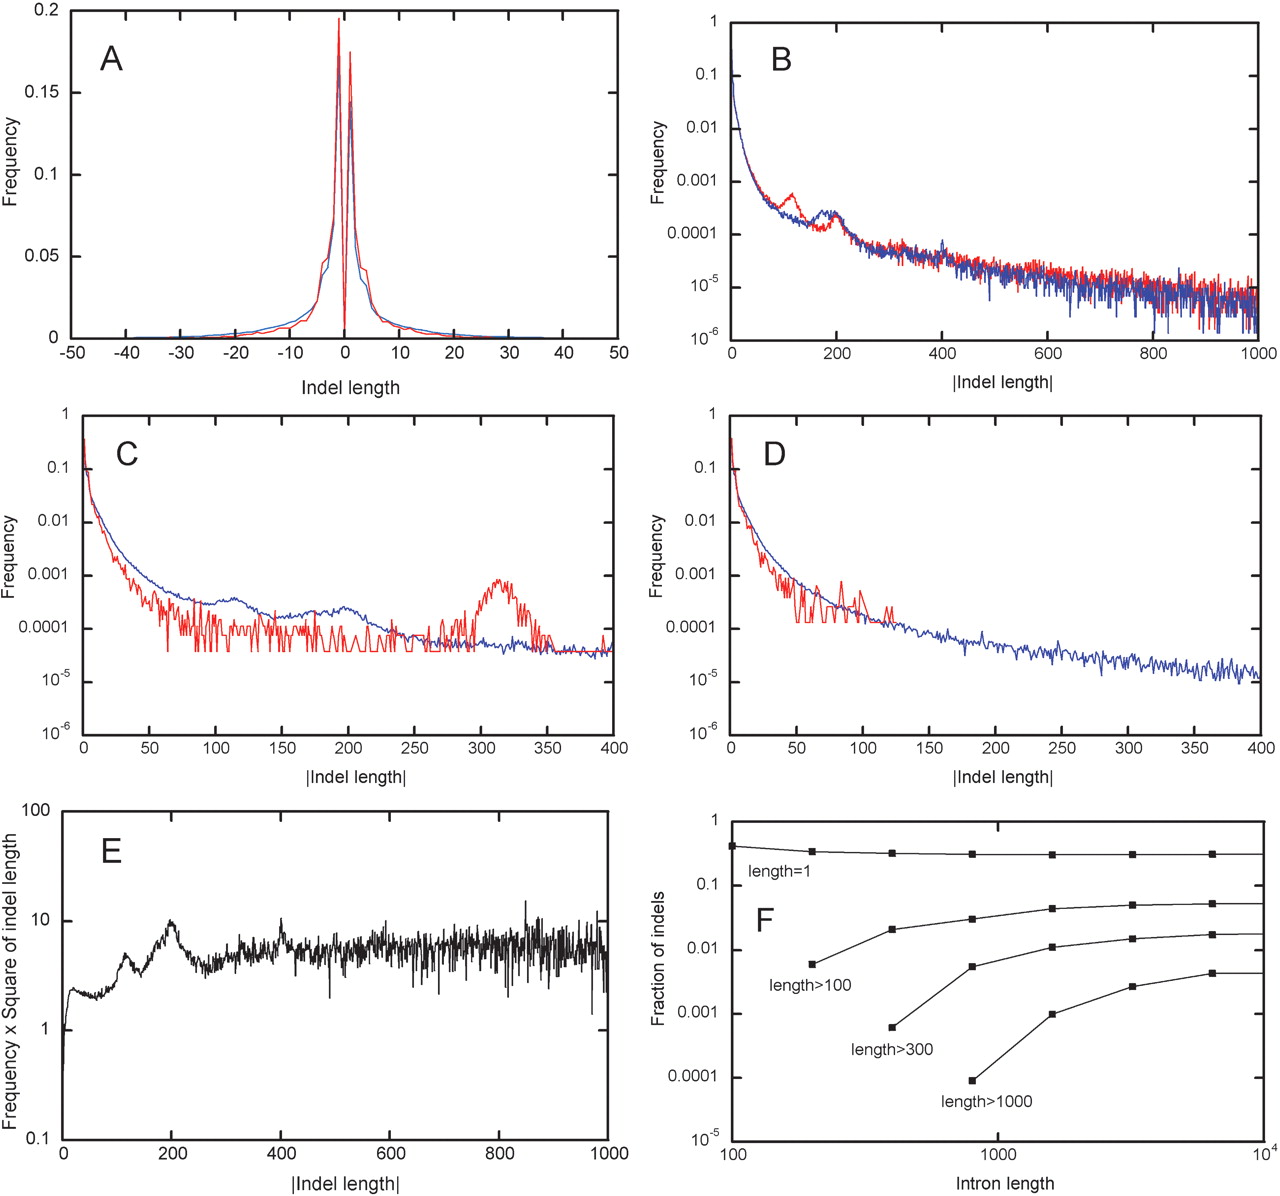
Lengths of individual indels. pm(δ) and ph(δ), distributions of lengths of all indels in all alignments (A) of rat–mouse (blue line) and human–OWM (red line) intron pairs. p+(δ) and p–(–δ), distributions of the absolute value of length of indels of only positive lengths (red line) and only negative lengths (blue line) in all rat–mouse alignments (B). P(δ) = (p+(δ) + p–(–δ))/2, the averaged distribution of the absolute value of length of indels with positive and negative lengths in all rat–mouse (blue line) and human–OWM (red line) alignments (C). The same as the previous figure, but indels were recorded only in those parts of alignments where neither of the two sequences was masked by RepeatMasker (D). P(δ) in all rat–mouse alignments, multiplied by δ2(E). Properties of distributions P(δ) obtained for rat–mouse pairs of introns with the following average lengths: 0–100, 100–200, 200–400,..., 6400–12800. For each distribution, fractions of indels of length 1 and of indels longer than 100, 300, and 1000 nucleotides are shown (F).


