
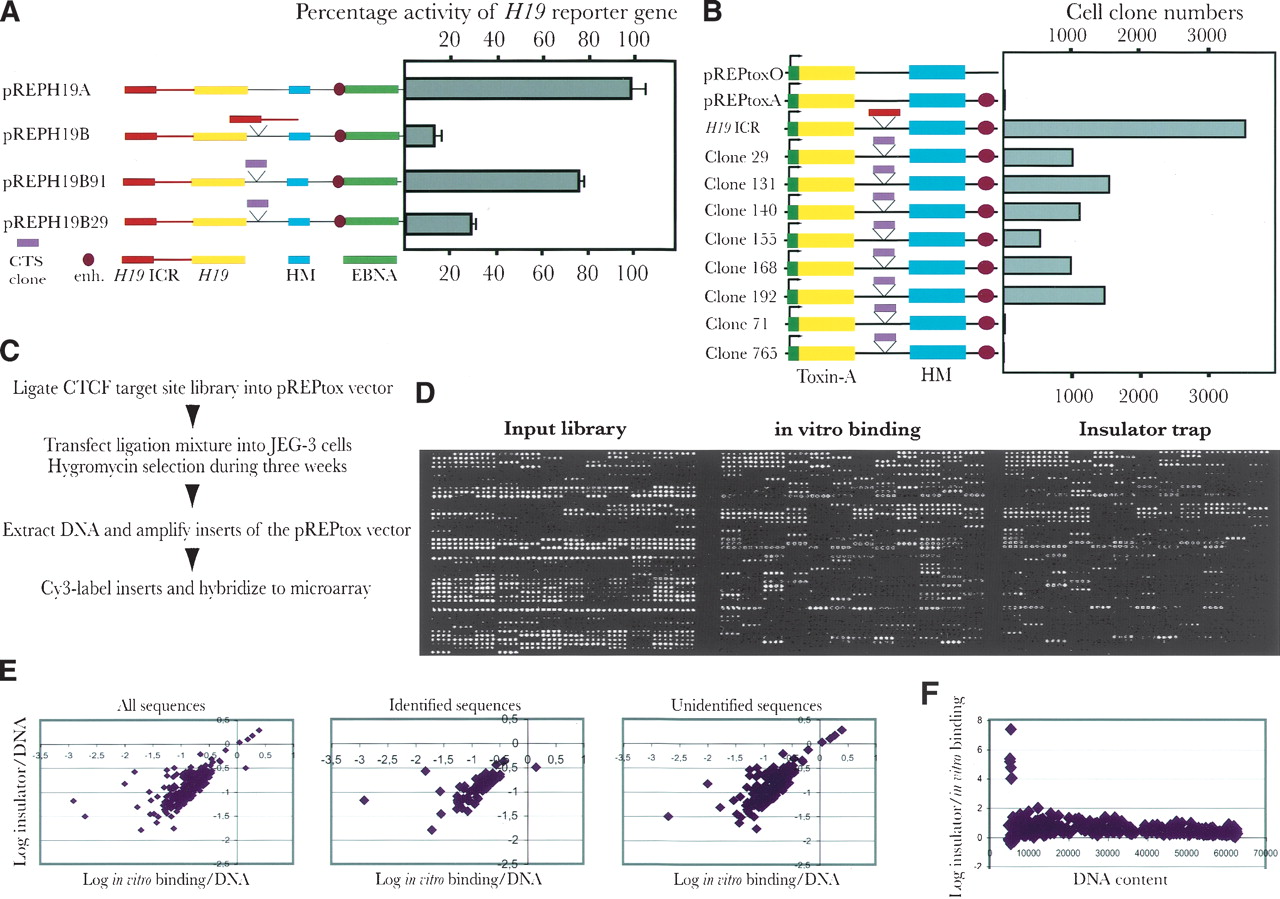
The insulator trap assay. (A) Schematic maps of the various constructs used in the classical insulator study. Symbols explained at the bottom of the panel. Each construct is linked to its performance in the enhancer-blocking assays, which were normalized to RNA input and episome copy number. The SV40 enhancer-driven expression of the pREPH19A construct was assigned a value of 100 whereas all other samples were normalized relative to this value. The mean deviation of three different experiments is indicated for each vector construct. (B) Schematic maps of the different pREPtox vectors. Cerise circle: the position of the SV40 enhancer. Green square: the H19 promoter. Pink and red blocks: the different inserts from clones (indicated by its original number) and H19 ICR, respectively. The numbers of the surviving clones were estimated from a colony count assay. (C) Outline of the strategy of the toxin-A assay and its application in microarray analysis of the CTCF target-site library. (D) An example of hybridization with input library sequences, affinity-purified (with recombinant CTCF) CTCF target sites, and the selection of clones with enhancer-blocking properties. (E) Presents scatter plot analyses of insulator strength, determined from the microarray analysis, and in vitro binding patterns, broken down into different sequence categories of the CTCF library. (F) Shows a scatter plot analysis between the insulator/in vitro binding ratios and DNA content of the corresponding spots of the microarrays, as determined by oligo hybridization.


