
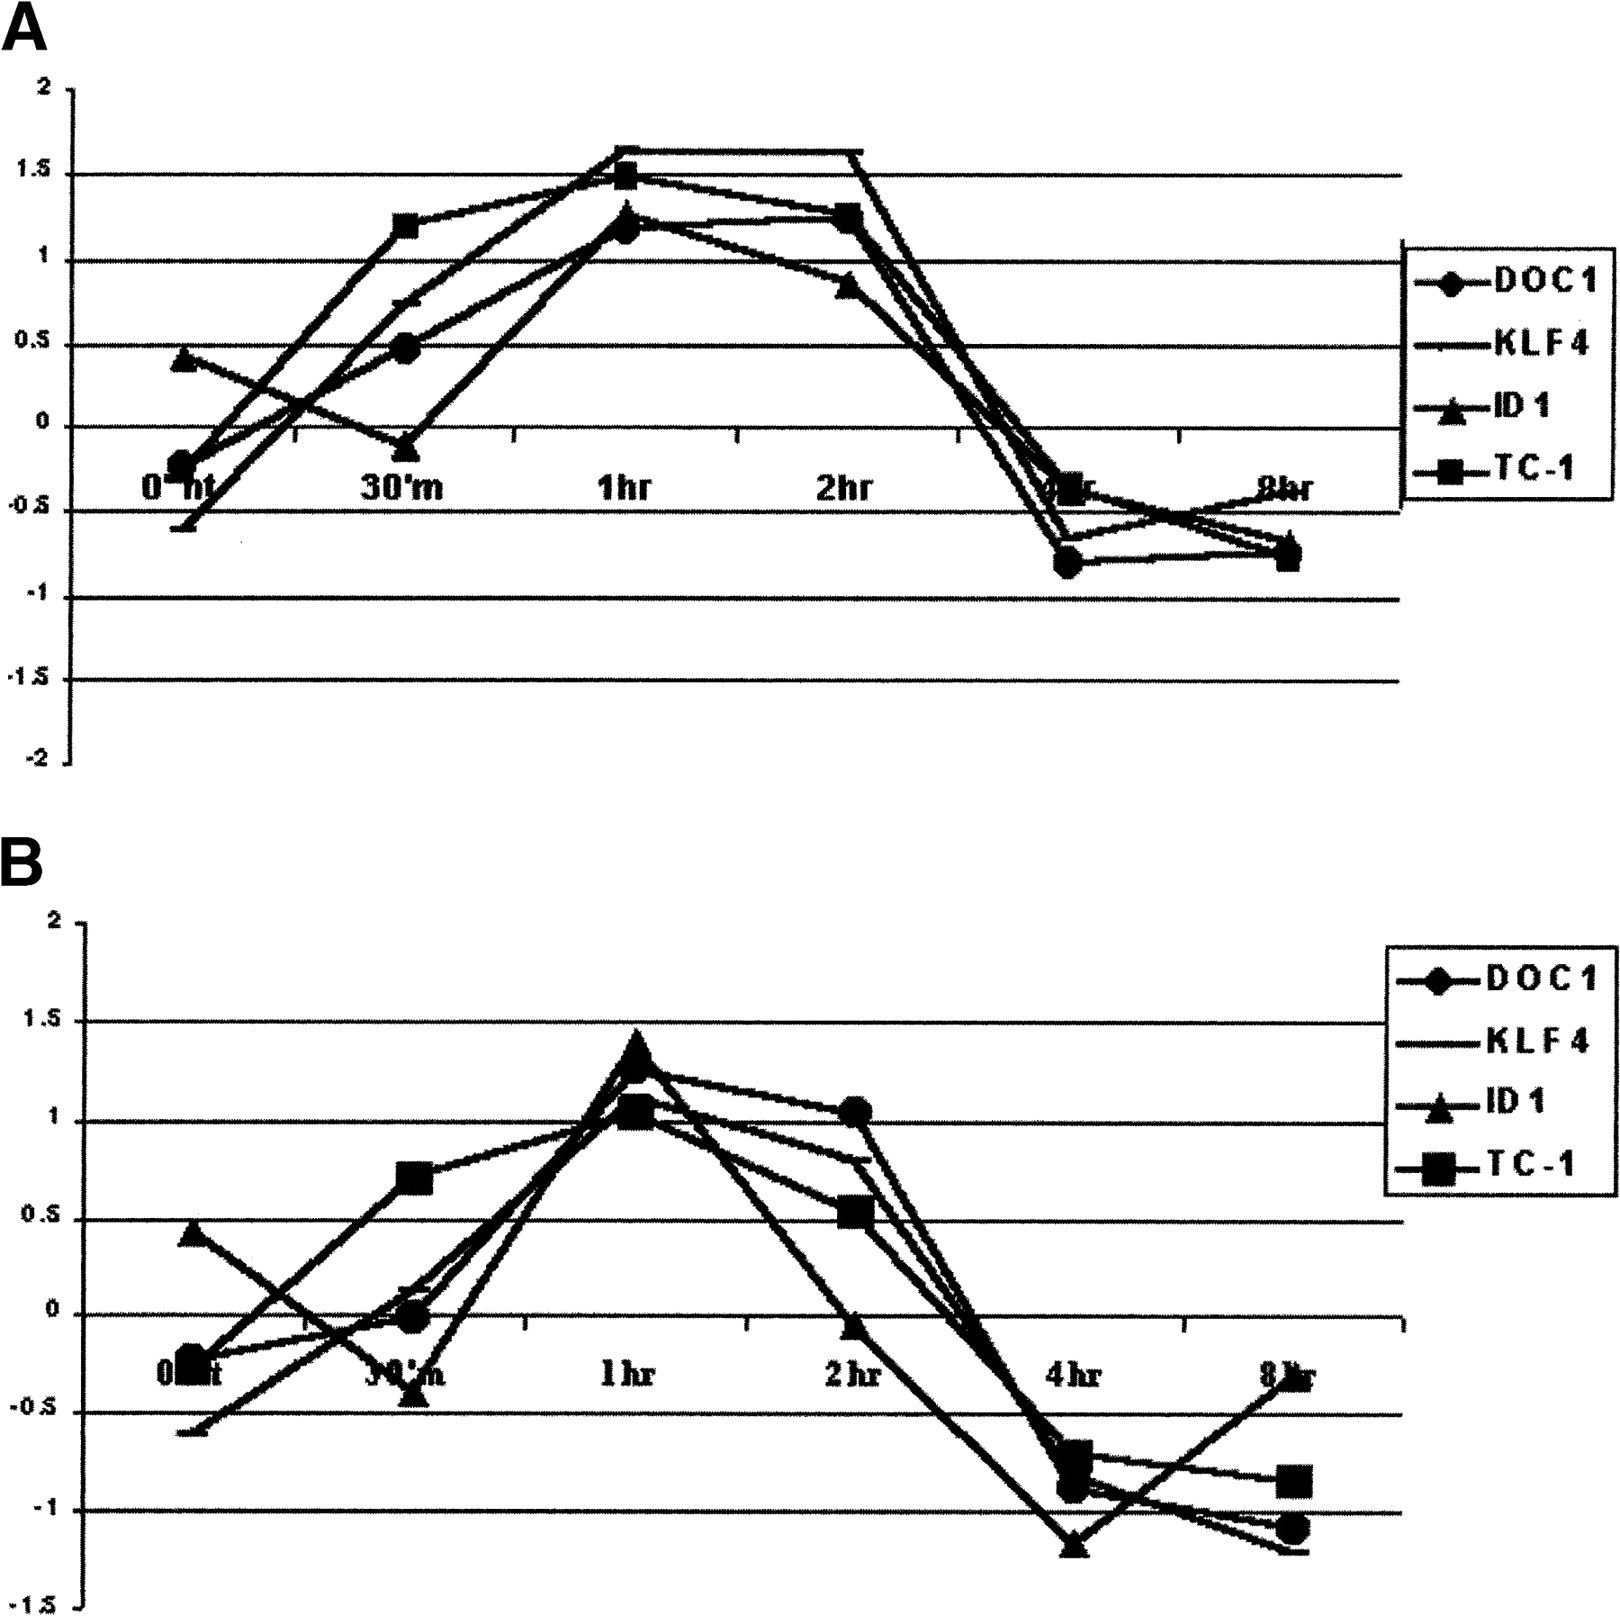
Figure 3
Gene expression profile for DOC1, KLF4, ID1, and TC1 over the time course of treatment with 10 μg/mL endostatin (A) and 10 nM fumagillin (B). Of the list of genes with twofold up- or down-regulation in at least one time point, we chose these four genes because they have the same time course of expression in response to the two inhibitors we used. The y-axis represents the ratio between treated and nontreated cells (Cy5 intensity value for treated over Cy3 intensity value for untreated).


