
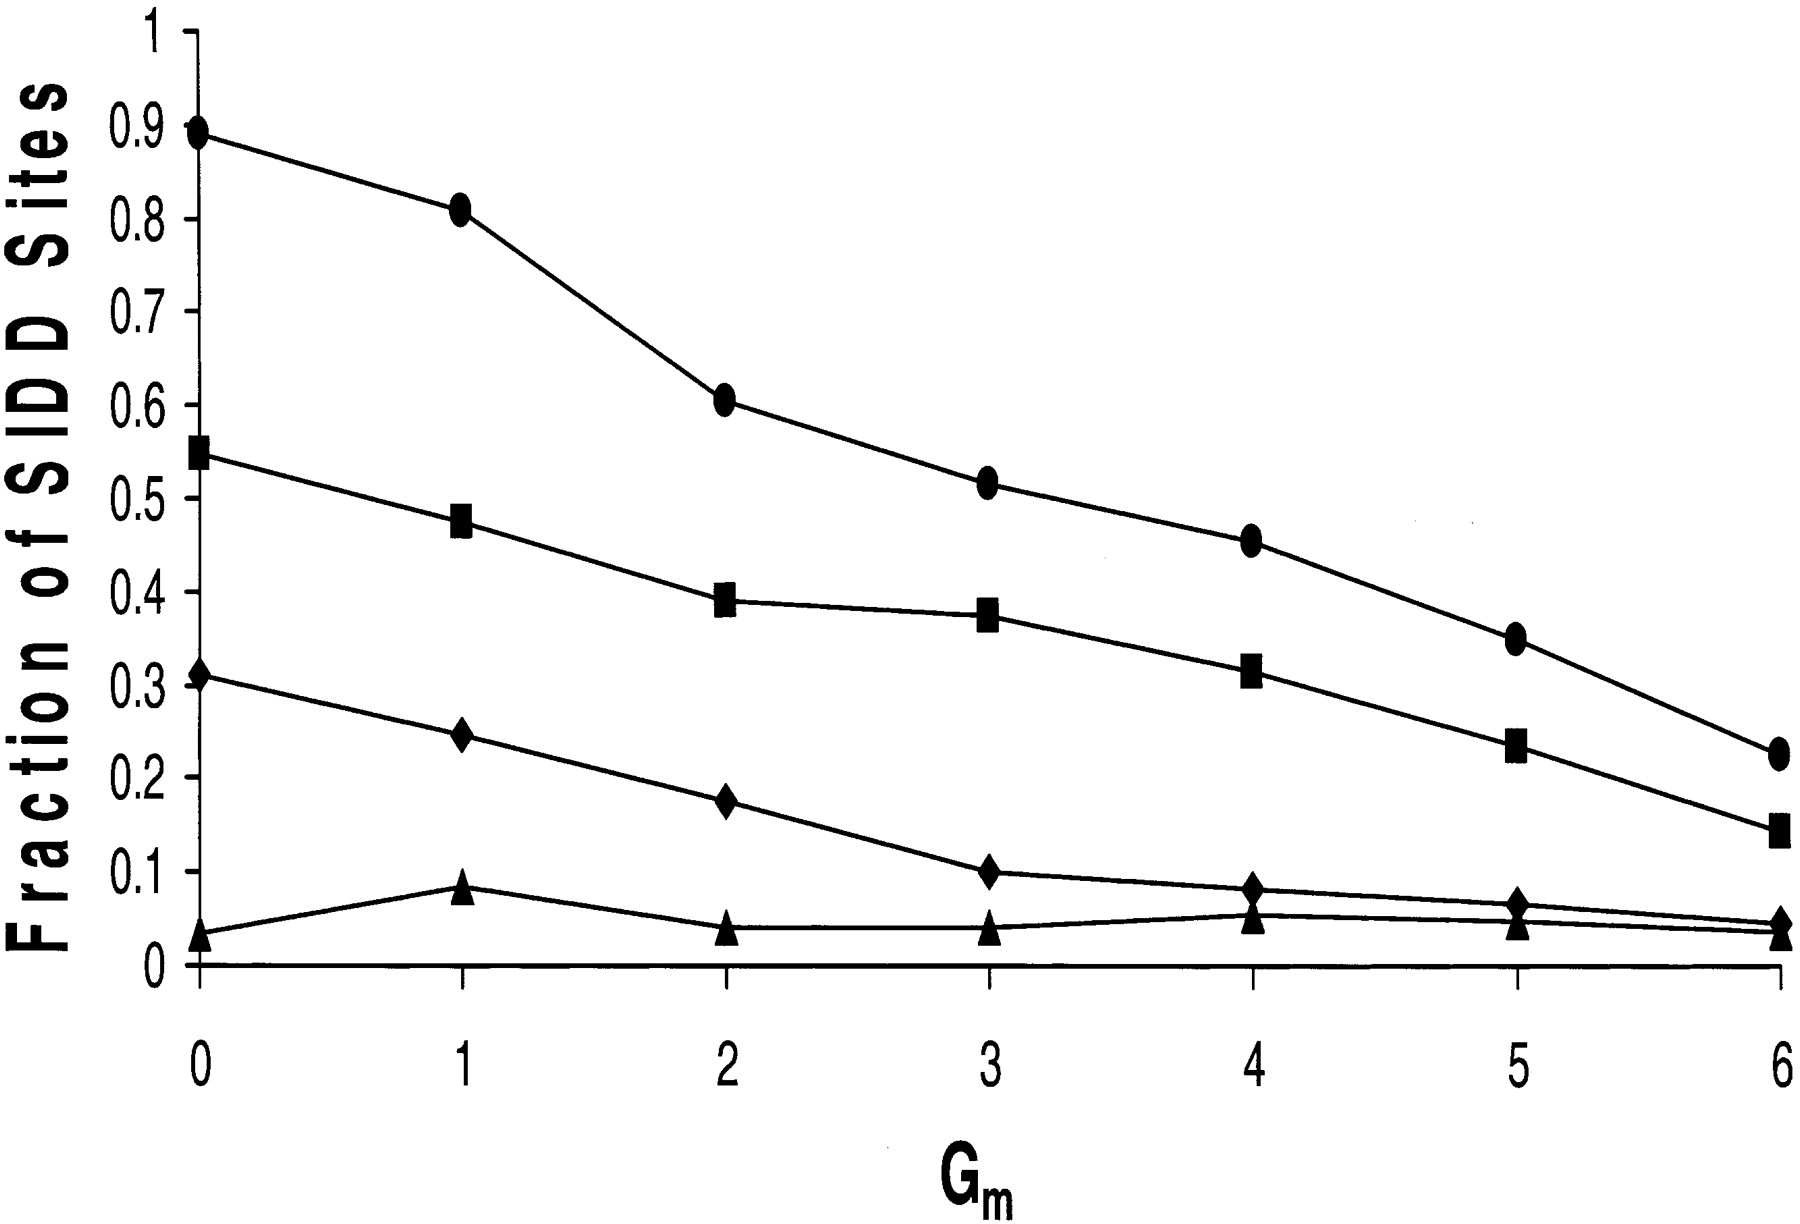
Figure 3
This figure plots the percentage of binned SIDD sites that overlap the various types of intergenic regions. The top line (circles) is for all intergenic regions, which are partitioned into the disjoint sets TAN, DIV, and CON. The values given by squares give the fraction of SIDD sites at each level that overlap regions in TAN; diamonds give the same information for DIV, and triangles for CON.


