
Figure 5
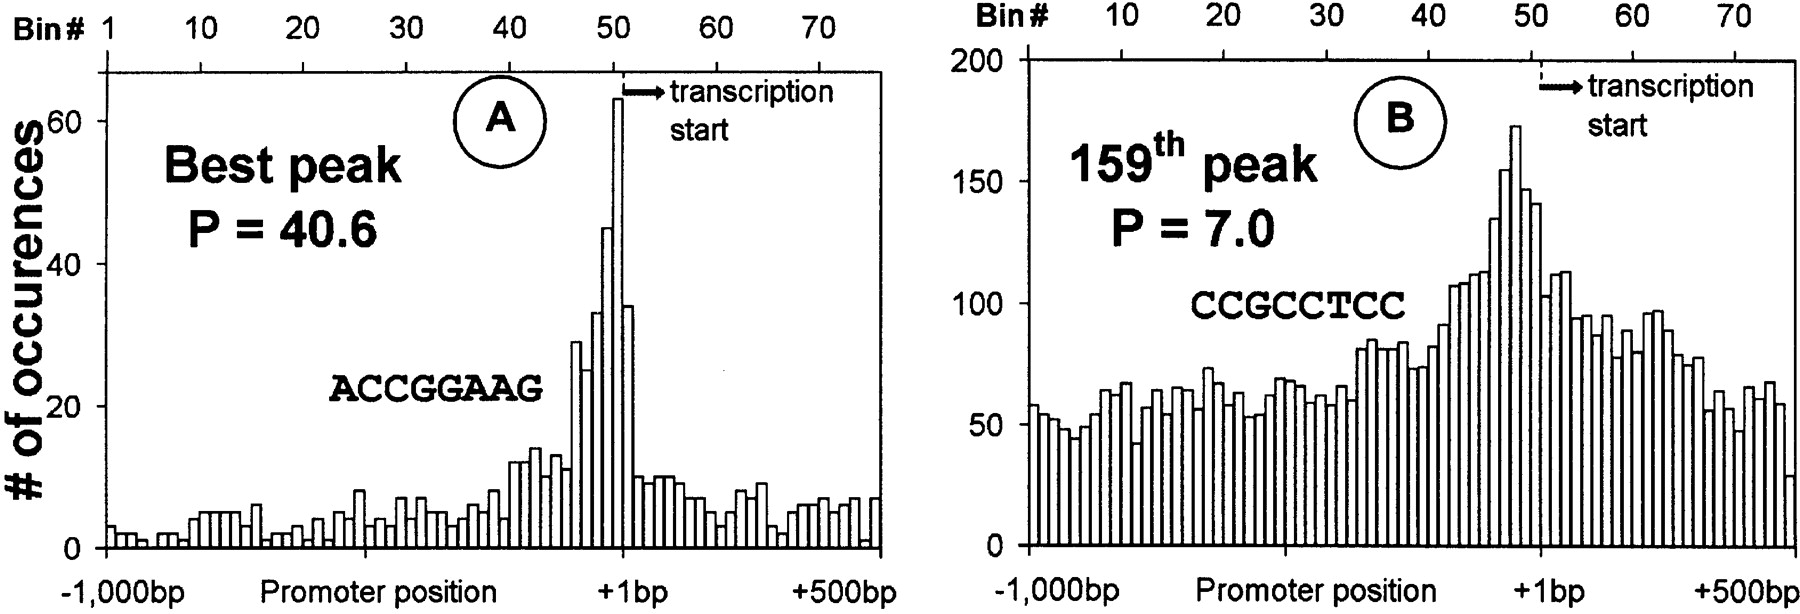
Distribution (number of occurrences per bin as a function of position relative to the TSS) of the DNA 8-mer (ACCGGAAG) that shows the greatest clustering (A) and the 159th 8-mer (CCGCCTCC; B).
(Downloading may take up to 30 seconds. If the slide opens in your browser, select File -> Save As to save it.)
Click on image to view larger version.
Distribution (number of occurrences per bin as a function of position relative to the TSS) of the DNA 8-mer (ACCGGAAG) that shows the greatest clustering (A) and the 159th 8-mer (CCGCCTCC; B).
 CiteULike
 Delicious
 Digg
Digg Facebook
 Google+
 Reddit
 Twitter
