
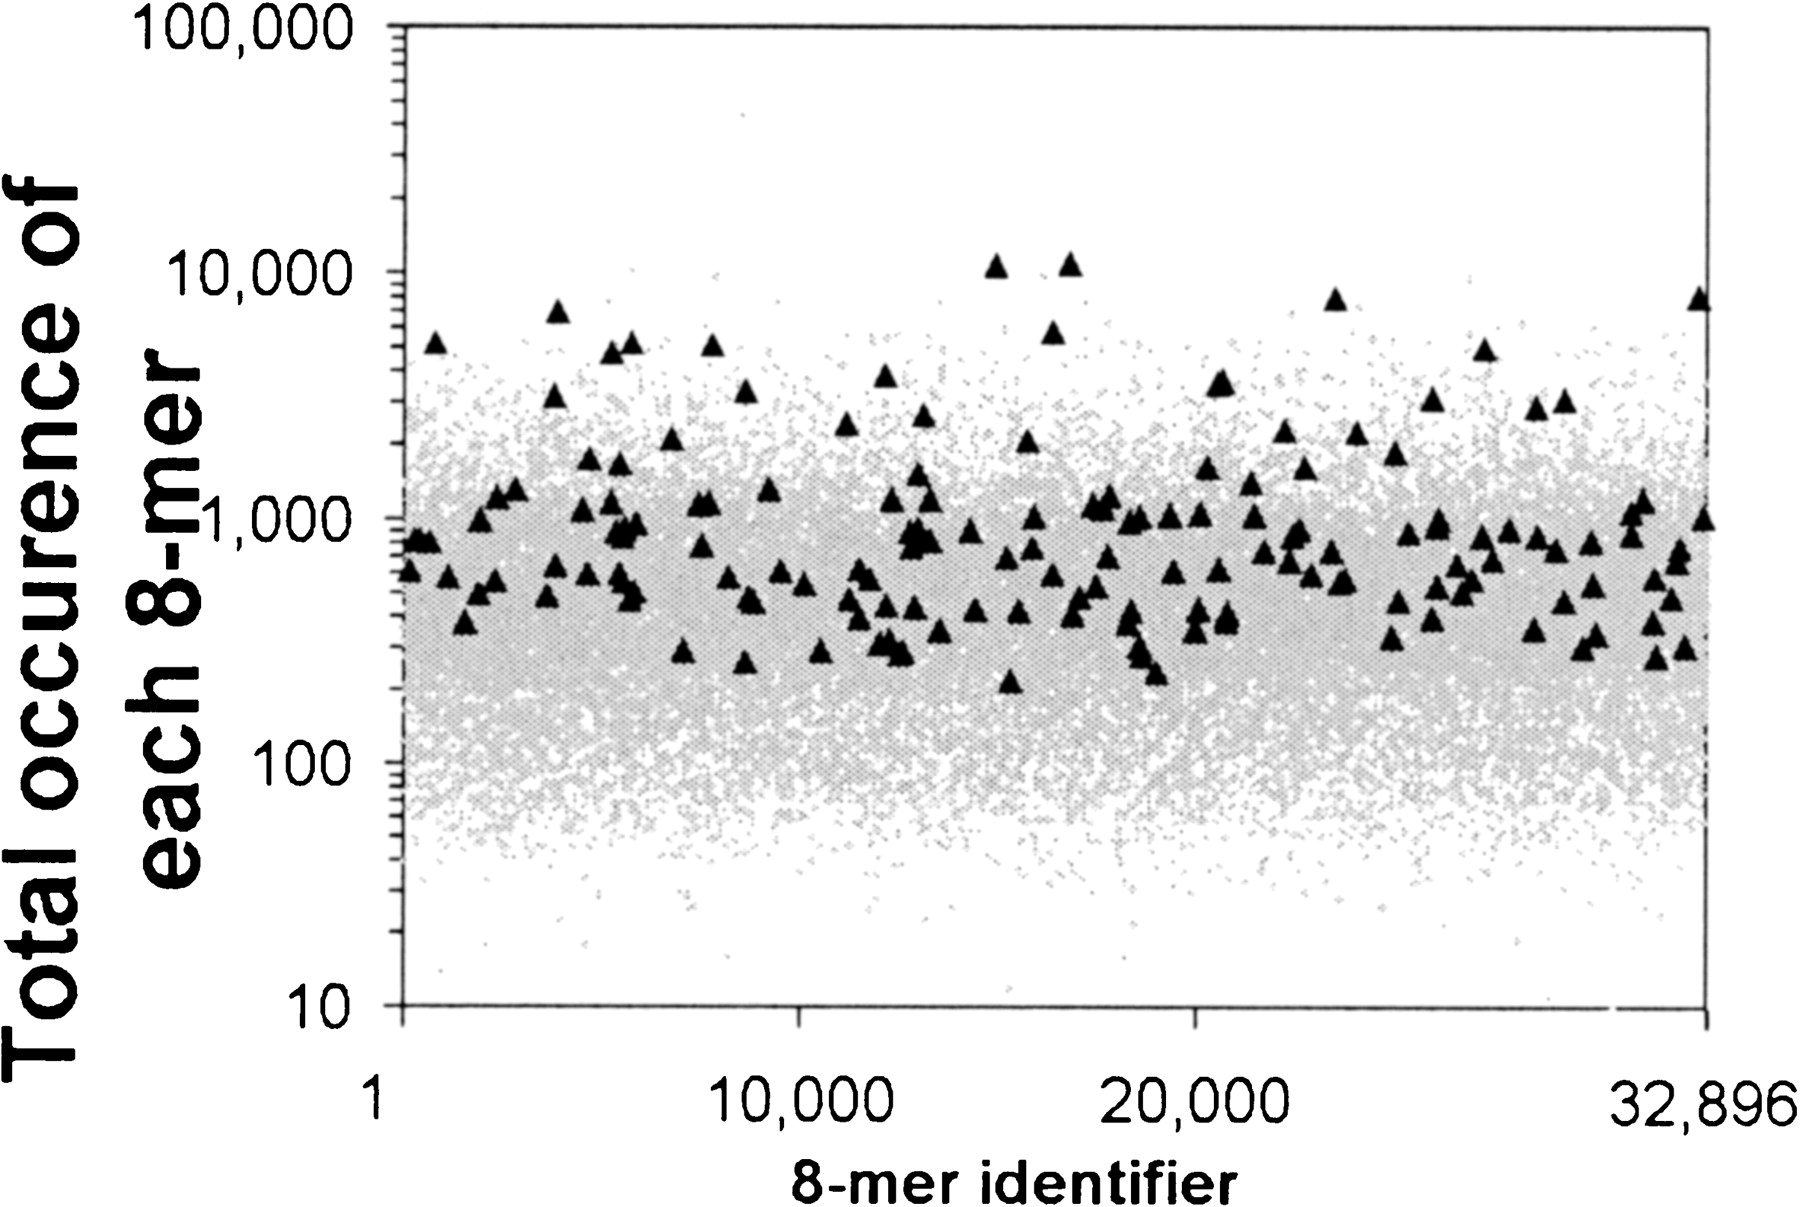
Figure 4
The number of occurrences of each 32,896 DNA sequence in the 13,010 promoter sequences is plotted as a gray dot. The abundance of all 159 sequences with P ≥ 7 is plotted as black triangles.
(Downloading may take up to 30 seconds. If the slide opens in your browser, select File -> Save As to save it.)
Click on image to view larger version.
The number of occurrences of each 32,896 DNA sequence in the 13,010 promoter sequences is plotted as a gray dot. The abundance of all 159 sequences with P ≥ 7 is plotted as black triangles.
 CiteULike
 Delicious
 Digg
Digg Facebook
 Google+
 Reddit
 Twitter
