
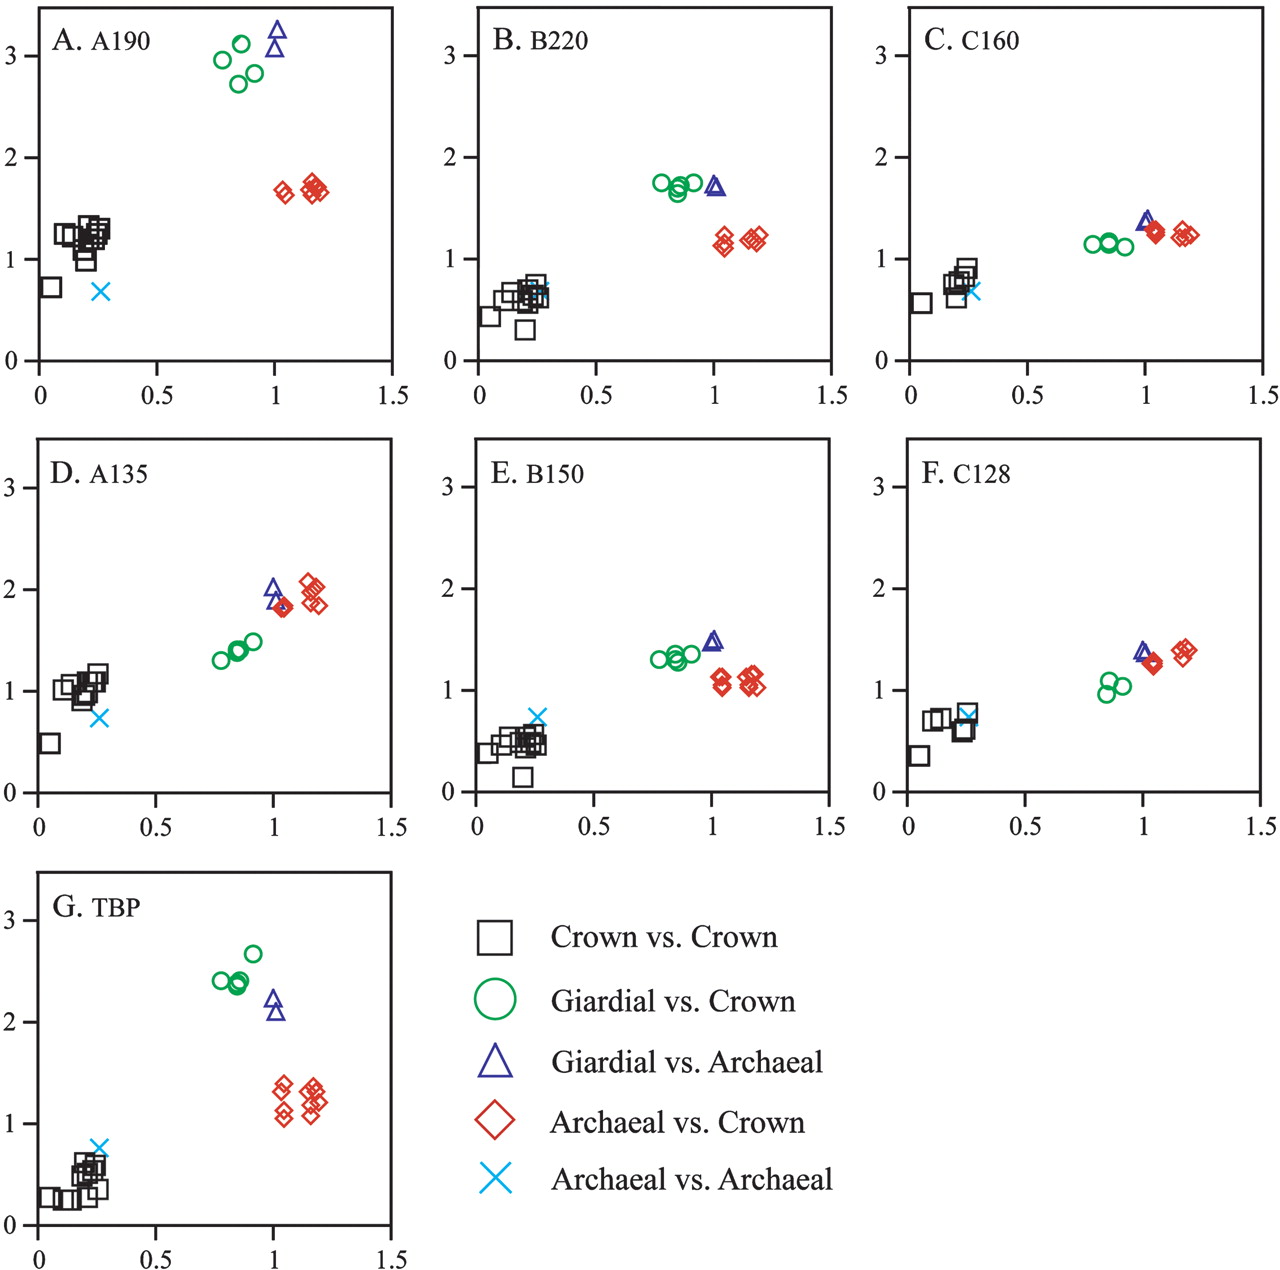
Figure 1
Comparisons of transcription component divergence with organismal divergence. Graphical representation of component distance (amino acid replacements per position) plotted on the y-axis vs. organismal small subunit rRNA distance (nucleotide substitutions per position) plotted on the x-axis. Data points are coded as indicated in the key. Error bars, one standard deviation uncertanties derived from 10 bootstrap replicates of protein distance calculations, are not visible at this scale. The identity of the RNAP subunit or transcription factor is indicated in A–G.


