
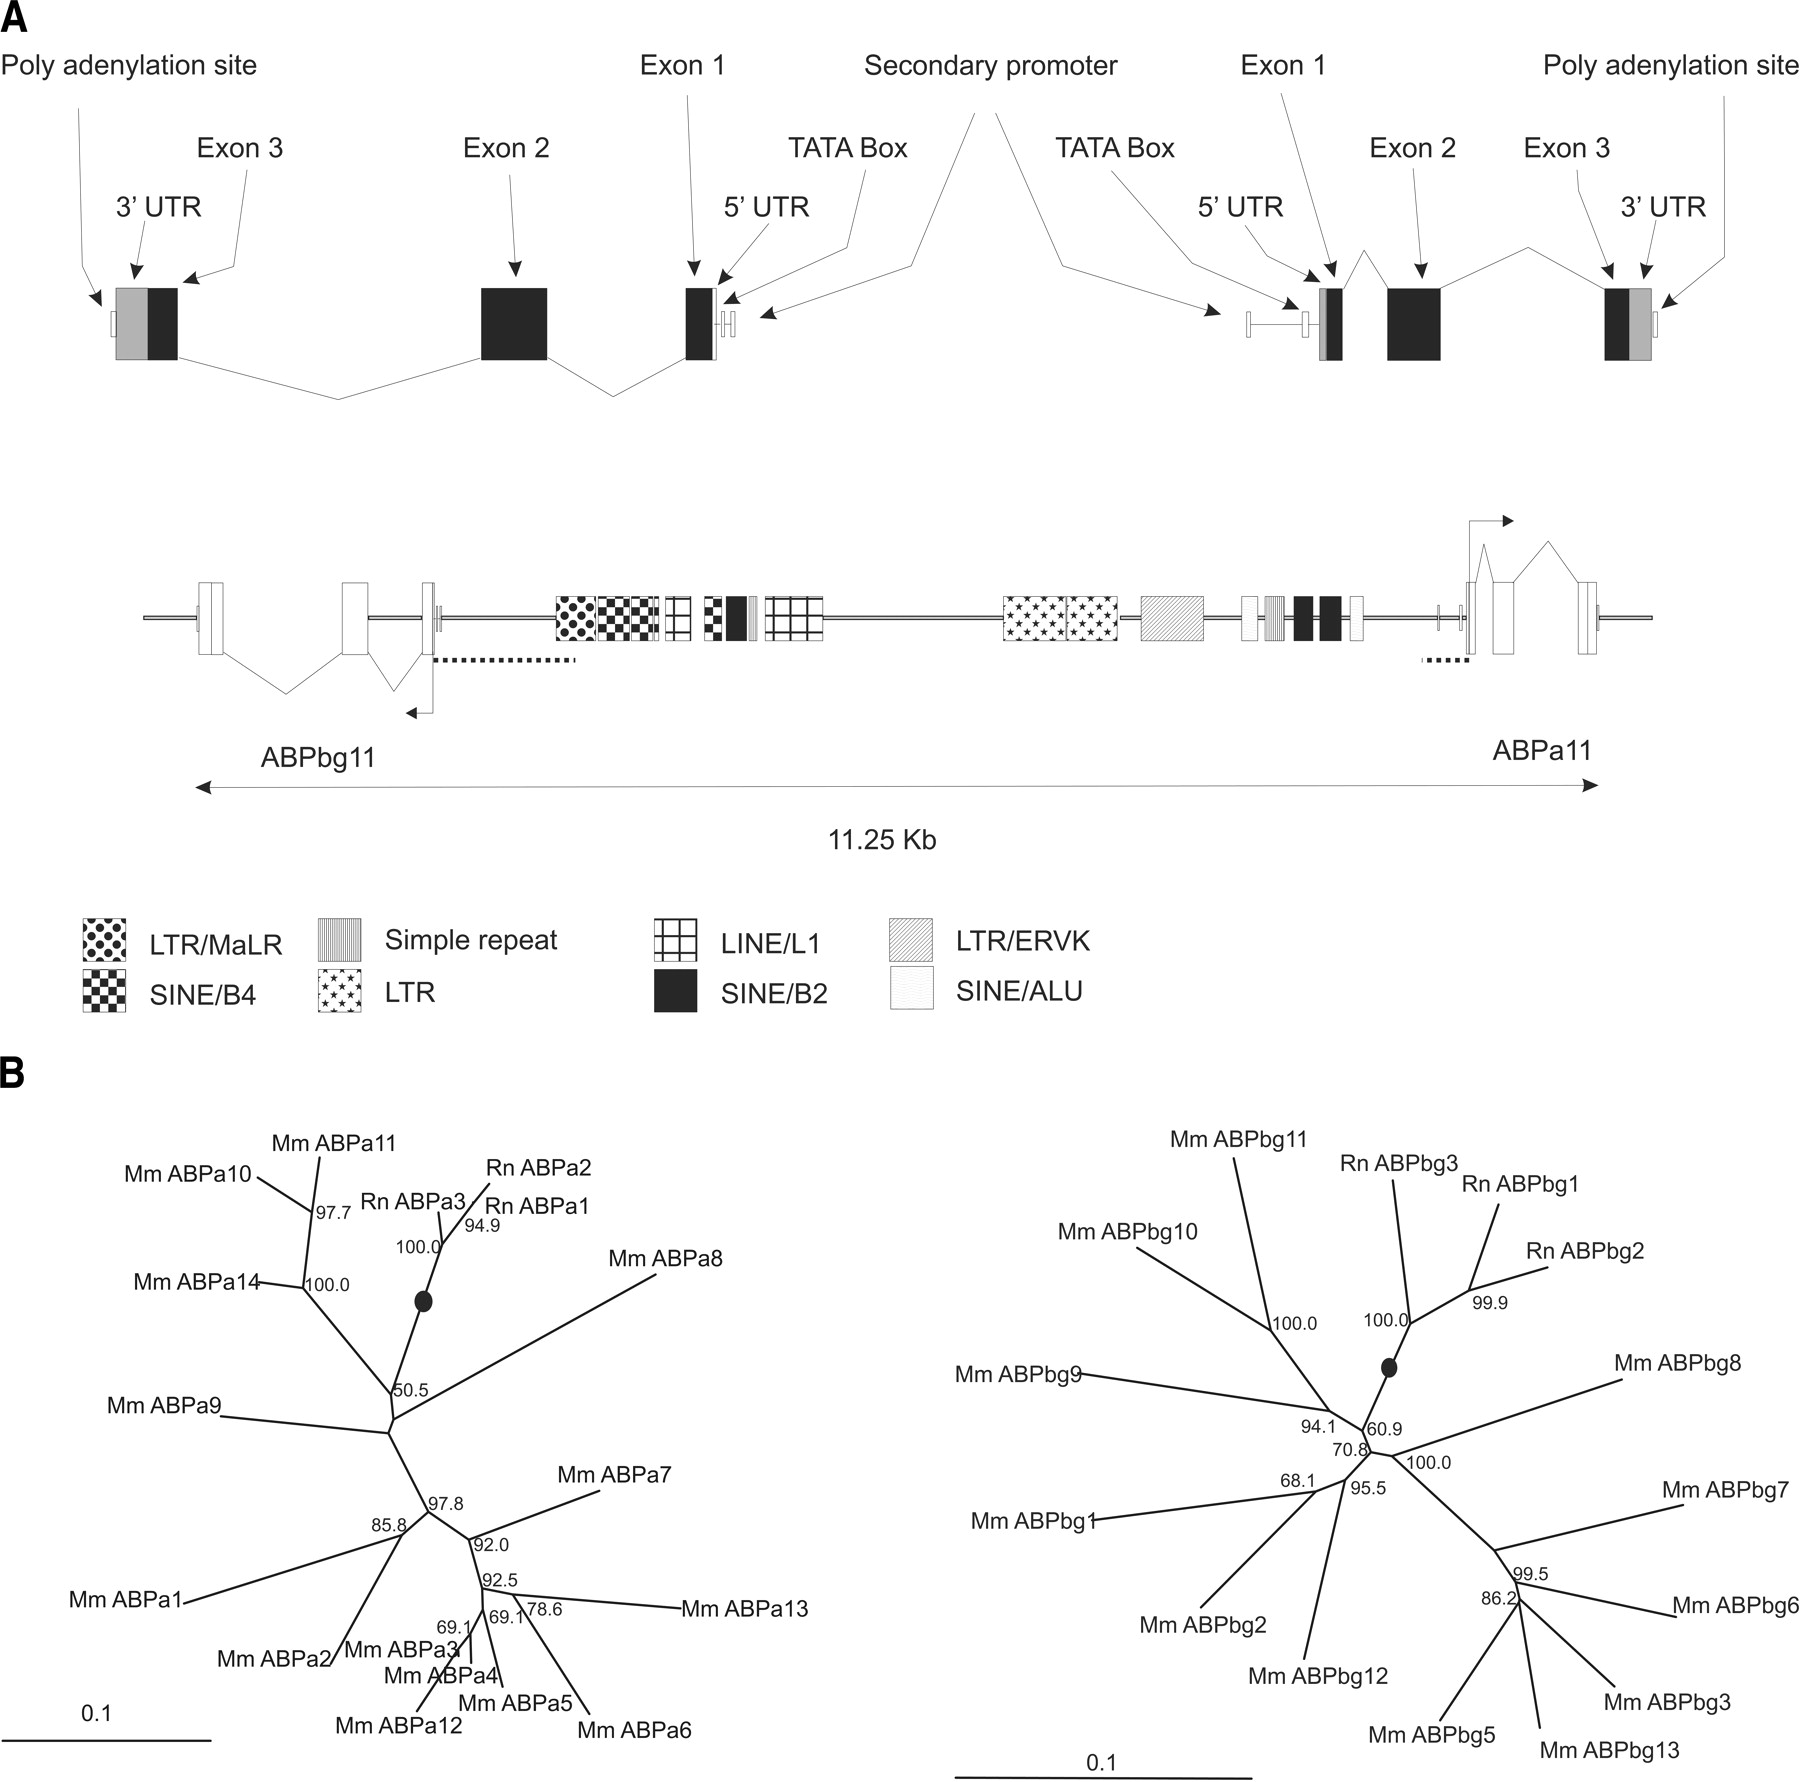
(A) Schematic representation of gene structures and repeat elements between the Abpa11 (Abpa) and Abpbg11 (Abpb) gene pair. The position and size of genes and repeat elements are shown to scale. Coordinates were obtained from the genome browser at UCSC (Kent 2002). The upper portion of the figure shows the genomic architecture of Abpa11 and Abpbg11 genes in greater detail. Highlighted regulatory elements correspond to those described previously (Laukaitis et al. 2003). The dashed lines represent the upstream regions used to generate the 5′ phylogenetic trees shown in B. (B) 5′ trees: phylogenetic relationships of rodent Abpa-like and Abpbg-like genes. Repeat-masked genomic DNA sequences 5′ upstream of Abpa-like genes and Abpbg-like genes were aligned (see Methods). For Abpa-like and Abpbg-like genes, 300 bp and 1 kb, respectively, 5′ to the translational start site were used for generation of the trees. Trees were generated using the neighbor joining method. The lineages containing the proposed roots of the trees are shown by black dots. Bootstrap values >50% are shown.


