
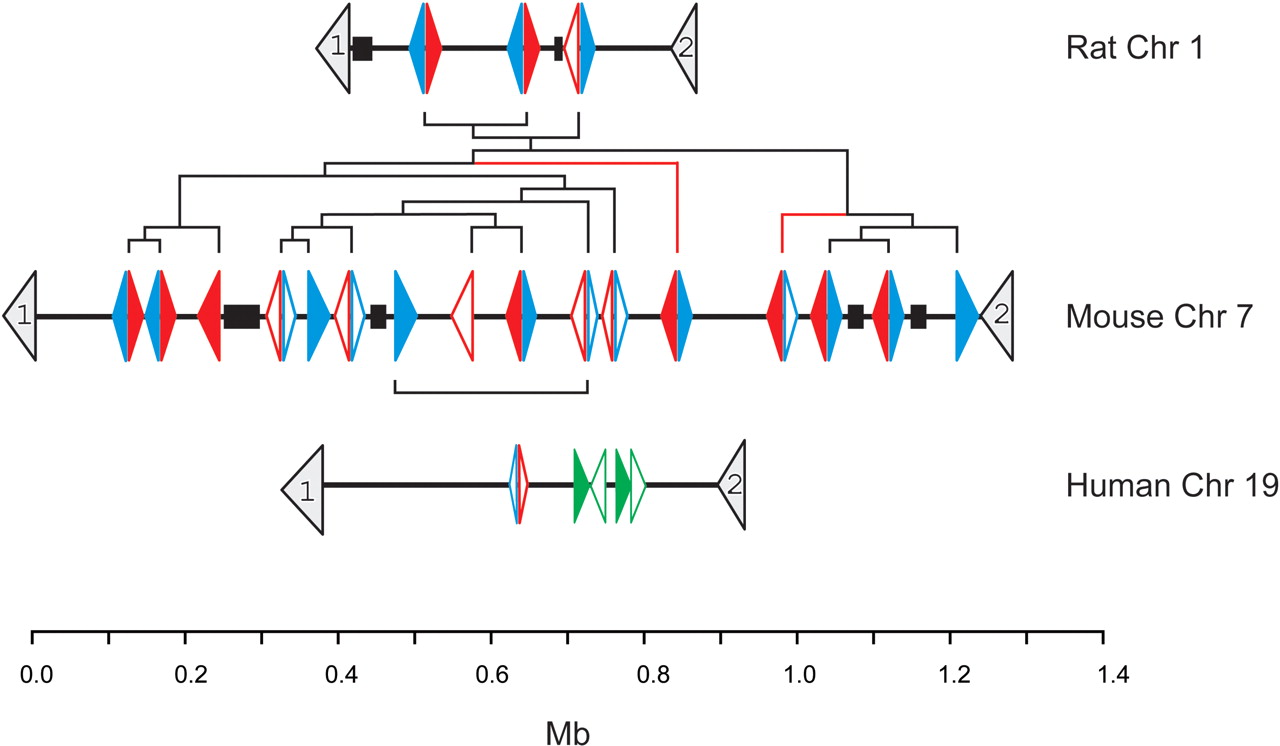
A graphical representation of the relative position and transcriptional orientation of the Abpabg-like genes and pseudogenes located on Rattus norvegicus Chromosome 1, Mus musculus Chromosome 7, and Homo sapiens Chromosome 19. Coordinates are taken from genome releases rn3 (Baylor RGSC v3.1), mm3 (NCBI build 30), and hg16 (NCBI build 34), respectively. The 5′-to-3′ orientations of the genes are shown by the direction of the arrowheads. Scn1b and Uble1b genes, which lie in orthologous genomic regions in all three species, are numbered 1 and 2, respectively. Abpa-like genes are shown in blue, Abpbg-like genes in red, and primate SCGB4A1–4(P) genes in green. Filled arrowheads represent predicted functional genes whereas open arrowheads denote predicted pseudogenes. The sequence of duplication events among rodent genes inferred from phylogenetic trees (see text) is implied from the dendrogram, shown in black. Blue and red lines in this dendrogram represent branches that are not supported by the phylogenetic trees shown in Figure 3 (see text). The scale bar shows approximate genomic distance in megabases. Gaps (>5 kb) in the genomic assembly of each species are shown as black boxes.


