
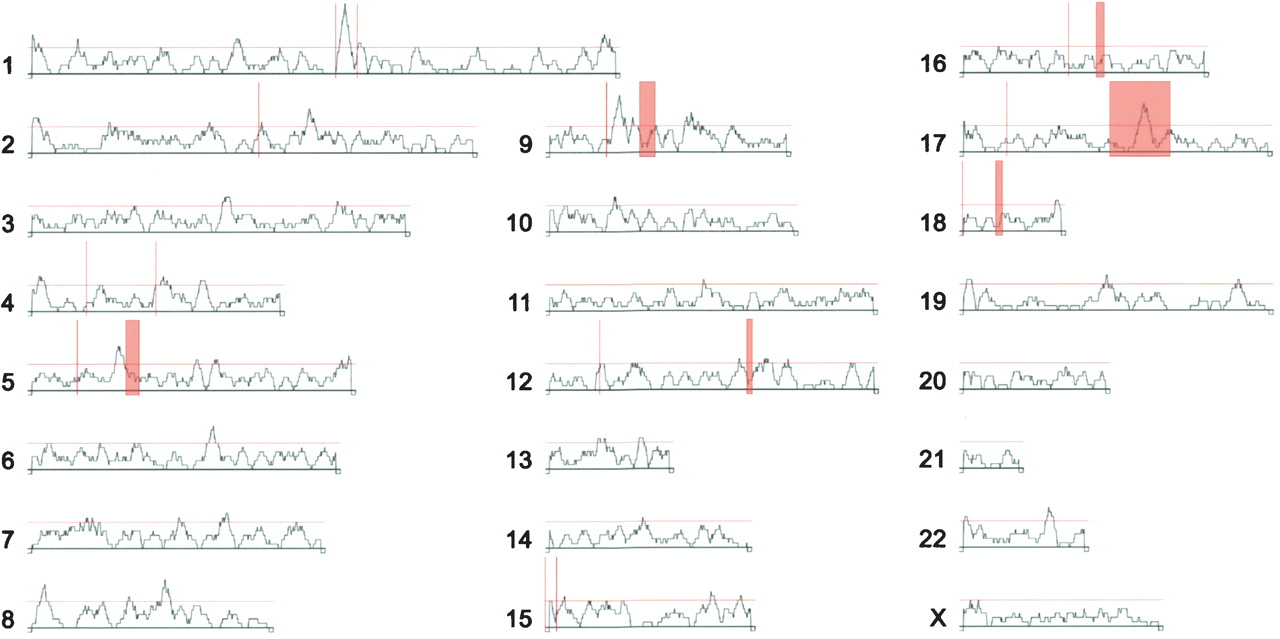
Figure 6
Distribution of gene expression differences between human and chimpanzee brains across the human genome. The profile over each chromosome shows the proportion of the differentially expressed genes in sliding windows containing 21 detected genes. Red horizontal lines indicate 5% significance cutoff. Red vertical bars indicate cytological bands to which the breakpoints of chromosomal rearrangements between humans and chimpanzees have been mapped (Yunis and Prakash 1982).


