
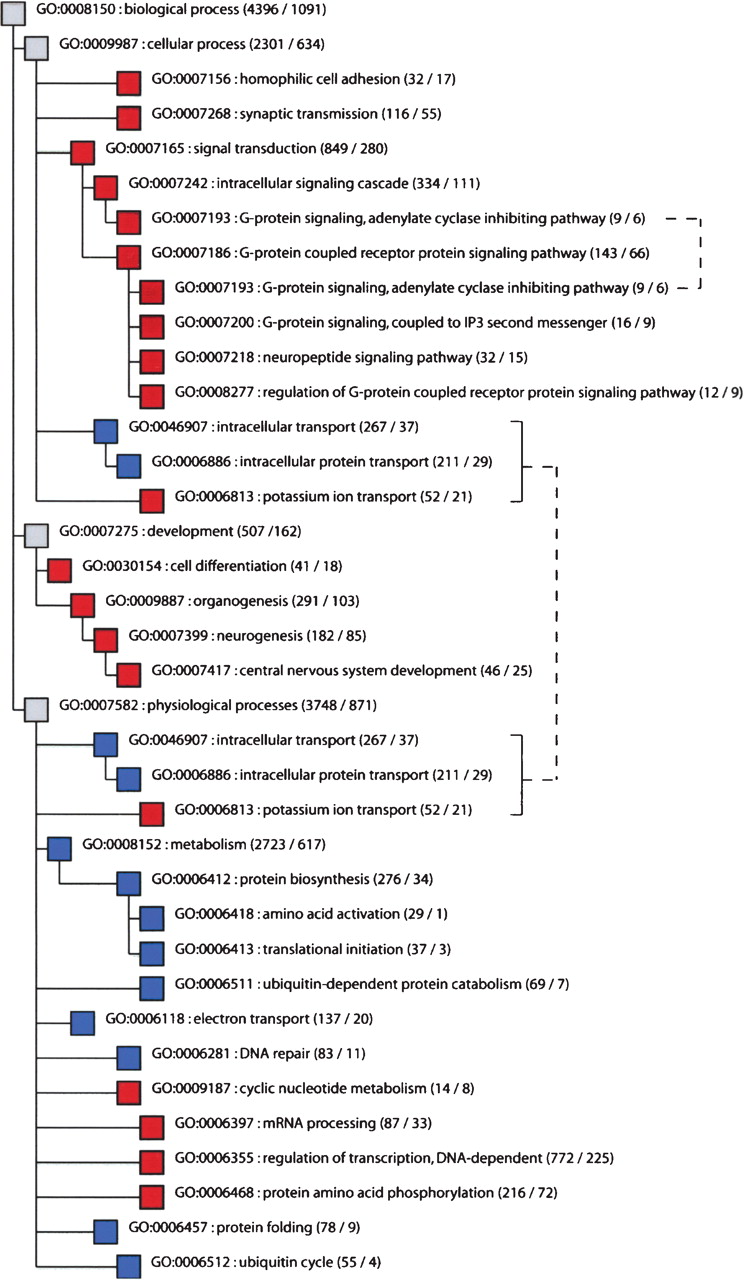
Figure 4
Groups of genes that show significant excess or significant lack of gene expression differences among brain regions in the GO taxonomy “biological process.” Red indicates significant excess of differentially expressed genes, and blue indicates significant lack of expression differences. Numbers of detected and differentially expressed genes in a group are shown in parentheses. Brackets to the right indicate cases in which the same functional group occurs multiple times in the tree.


