
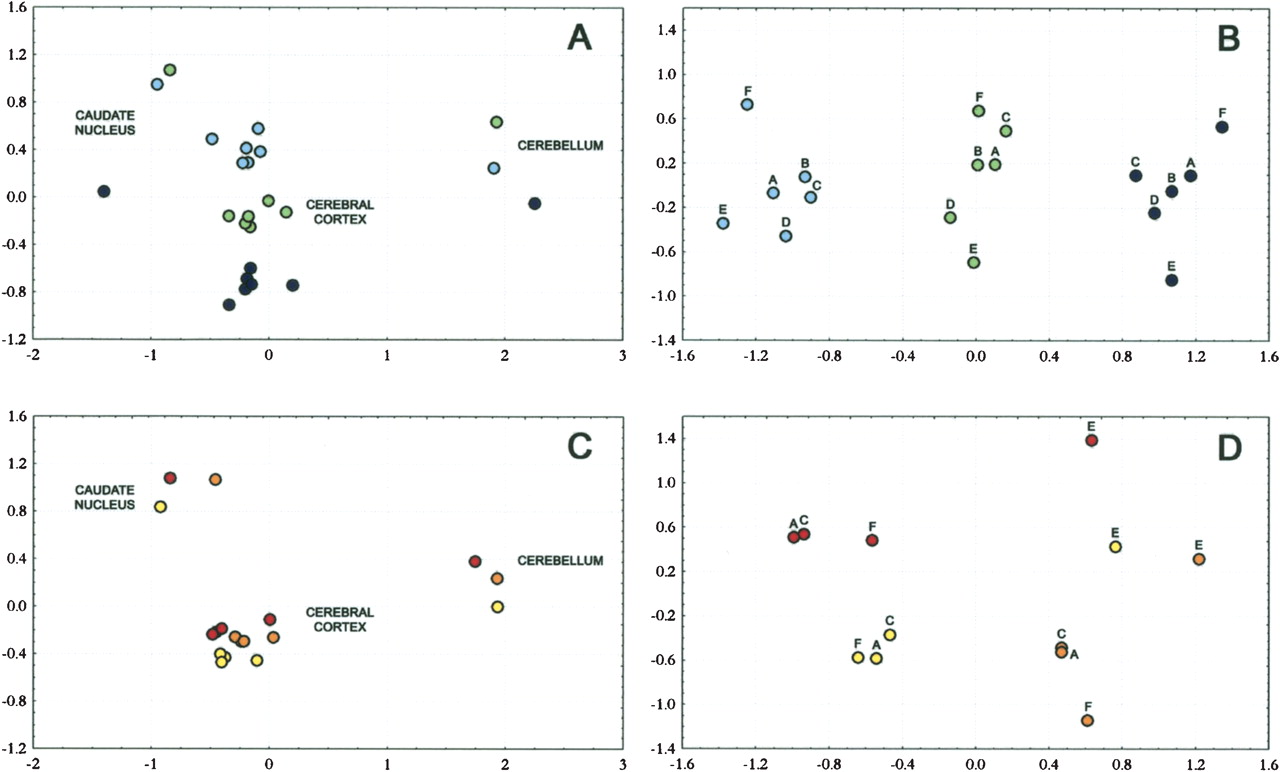
Figure 2
Multidimensional scaling plots of gene expression differences identified within species. The colors refer to individuals. (A) Expression differences in humans. (B) Expression differences within the human cerebral cortex. (A) Broca's area; (B) homolog of Broca's area in the right hemisphere; (C) prefrontal cortex; (D) premotor cortex; (E) primary visual cortex; (F) anterior cingulate cortex. (C) Expression differences in chimpanzees. (D) Expression differences within the chimpanzee cerebral cortex. Labels as in (B).


