
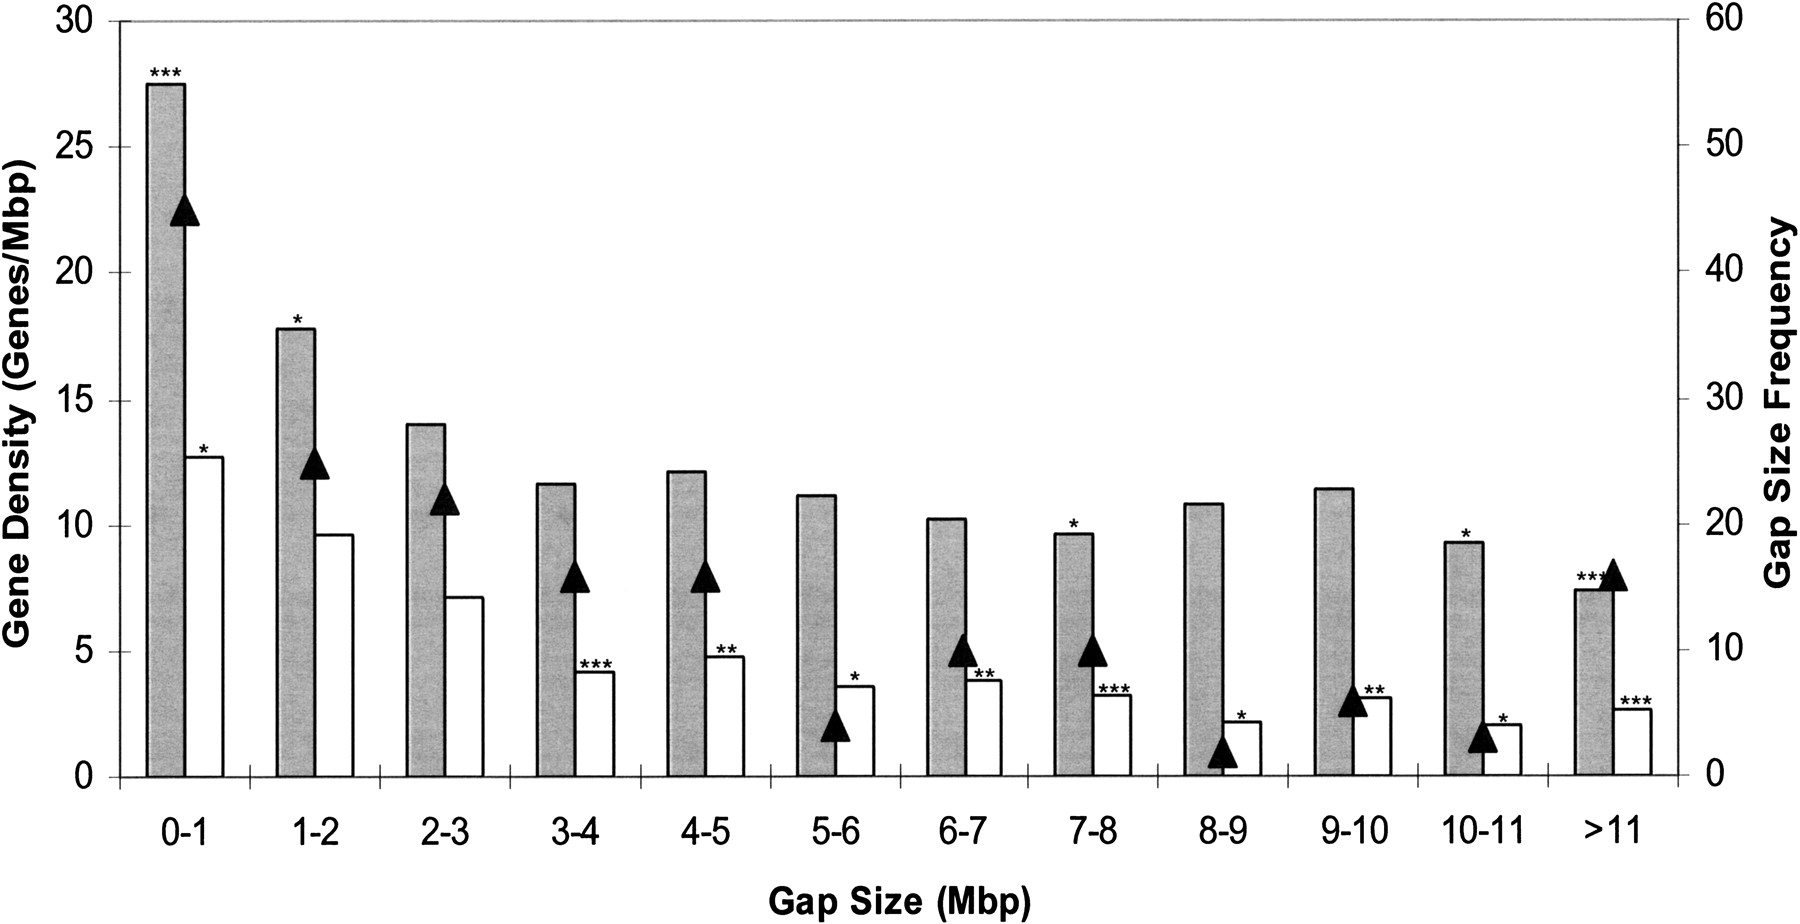
Gap size distribution and gene density within gaps on the cattle–human comparative map. The frequency of gaps of different sizes is indicated on the figure by “▴”. Gene density was determined as described in Methods. Shaded bars indicate known and predicted genes (NCBI build 33); clear bars are RefSeq genes (NCBI release 1). Asterisks above the bars indicate the significance level of the comparison of gene density to the genome-wide average (*, P < 0.05; **, P < 0.001; ***, P < 0.0001). Gap sizes include those gaps in the comparative map that correspond to chromosome rearrangements, excluding boundaries at conserved telomeres and around centromere insertions.


