


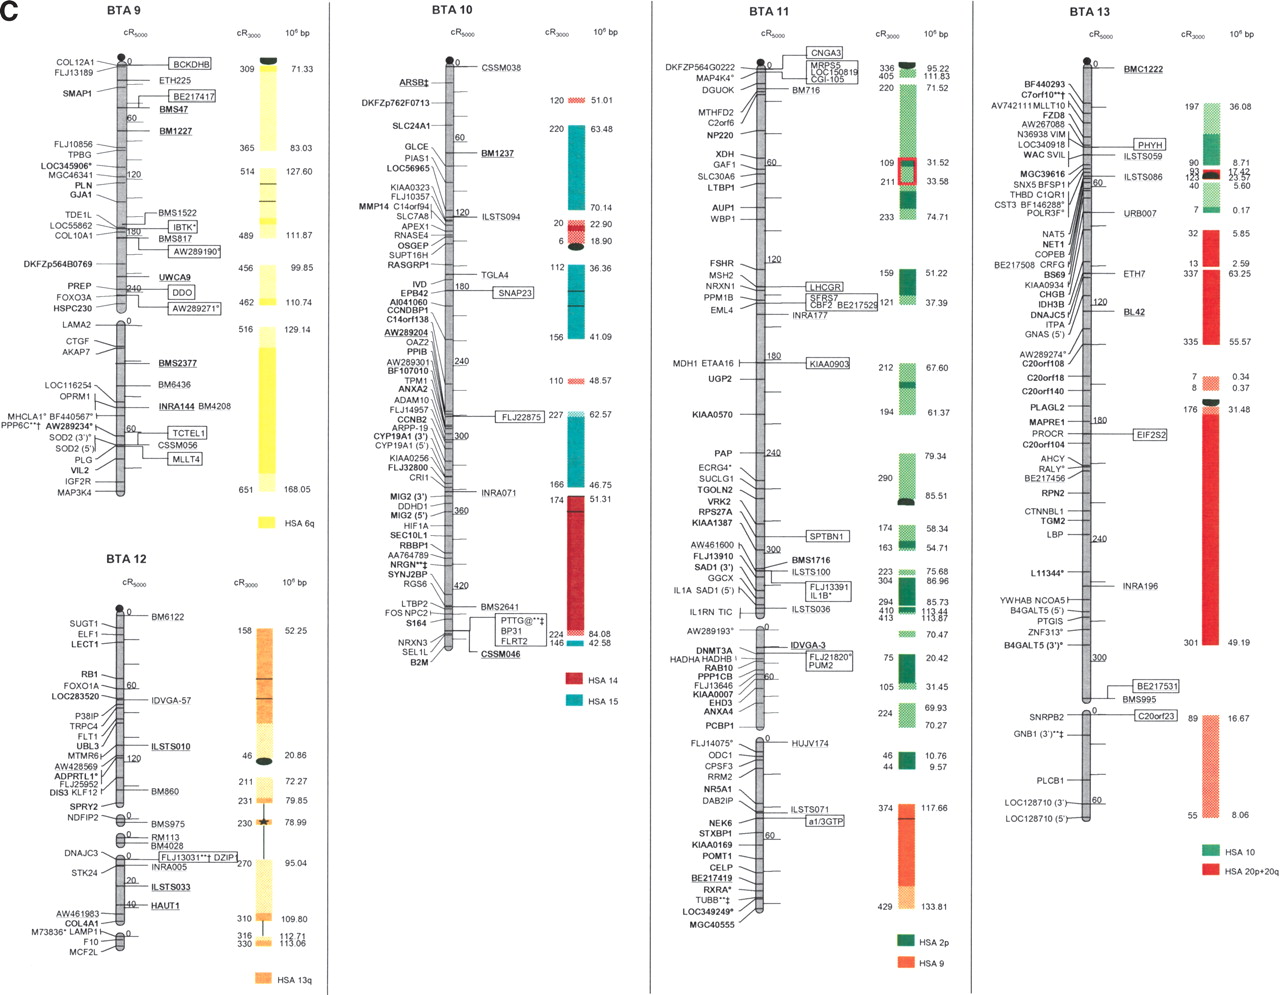


The second-generation cattle RH5000 and cattle–human whole-genome comparative chromosome maps. Cattle chromosomes are indicated by vertical shaded gray bars. Linkage groups on chromosomes are separated by blank spaces, and markers that are placed on the map on the basis of their two-point linkage data are binned to the right of the chromosomes. Cattle orthologs of human genes are named with the human gene symbol. Homologous human chromosome segments are color-coded, with segments defined on the first-generation map (Band et al. 2000) indicated as solid bars and improvements in coverage indicated by shading. GenBank accession nos. are used for cattle-specific sequences and for significant hits to human sequences with no gene symbol. Orthologs identified with sensitive BLAST options are indicated by the symbol “°”. Framework markers are shown in boldface type. Solid black lines running through a segment (e.g., the fifth conserved segment on BTA1) indicate framework markers that are not in the same order as in the human map. The comparative maps were constructed as described in Methods. Markers for which there is no map position based on the human genome sequence are underlined. An asterisk (*) indicates a single gene at a position that is inconsistent with the expected gene order based on the human sequence-based map. Single genes that map to chromosomes that are inconsistent with COMPASS predictions based on human sequence coordinates have a double asterisk (**). Single genes that have inconsistent COMPASS predictions based on human sequence coordinates but COMPASS predictions consistent with UniGene are indicated with a double asterisk and double dagger (**‡). A double asterisk and single dagger (**†) are used when there is inconsistent mapping information based on human genome sequence information and no UniGene GB4 information for comparison. Lines connect human segments that span gaps in the cattle RH map and have no evidence of chromosome rearrangement. Small regions on BTA2, BTA11, BTA16, and BTA25 that have gene orders that produced problems in creating distinct comparative segments are indicated by solid lines (colored for visibility) forming a box within the corresponding human segments. Segments on BTA4, BTA12, and BTA16 that appear to be out of place on the comparative map (i.e., segments that should be contained within other segments but appear as distinct) are indicated by a large asterisk within the segment. Human genome sequence coordinates are shown on the right side and GB4 cR3000 distances are on the left side of the conserved segments. Human centromeres are represented as full black circles if the position is within a conserved segment or on an acrocentric chromosome located at a segment boundary, or half circles if on a metacentric chromosome located at a segment boundary.


