
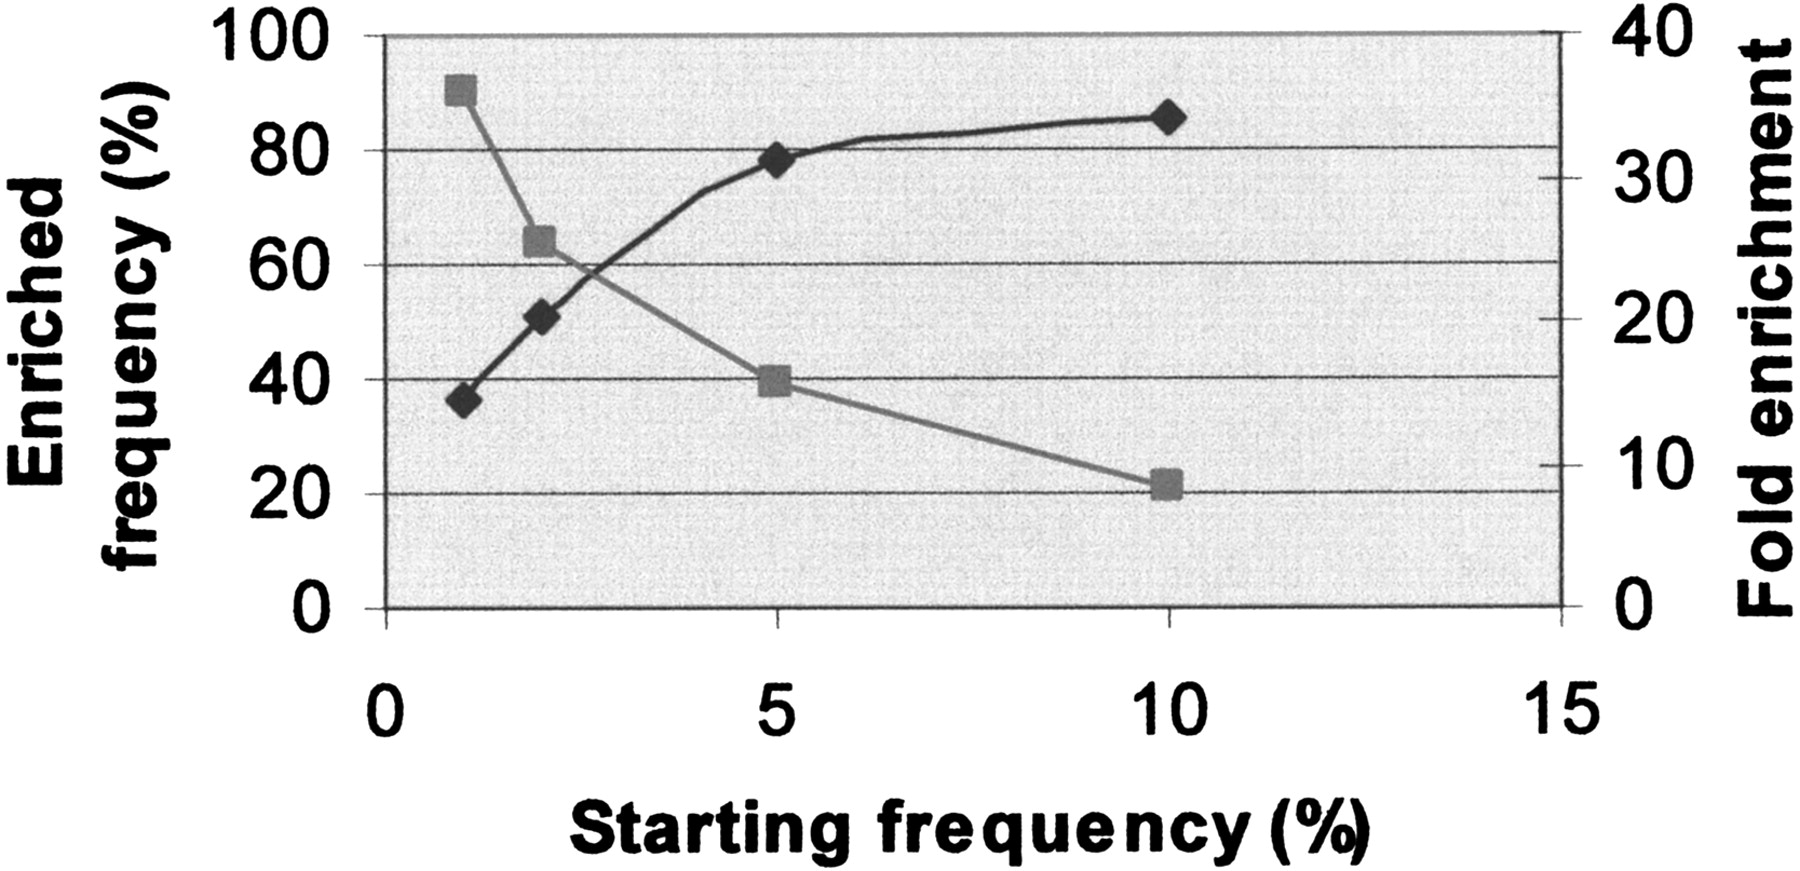
Figure 6
Extent of enrichment. This figure shows the average enrichment for detected SNPs with starting allele frequencies of 1%, 2%, 5%, and 10%. To generate this graph, we obtained the average frequency in the variant pool of the detected SNPs that were initially at 1%, 2%, 5%, or 10%. The estimation of the enriched frequency was done as previously described (Kwok et al. 1994). As expected, the rarer alleles have higher-fold enrichment but continue to have lower frequency in the enriched pool. For example 1% and 10% alleles get enriched 36- and 8.5-fold, respectively, to achieve in the variant pool 36% and 85% frequencies, respectively.


