
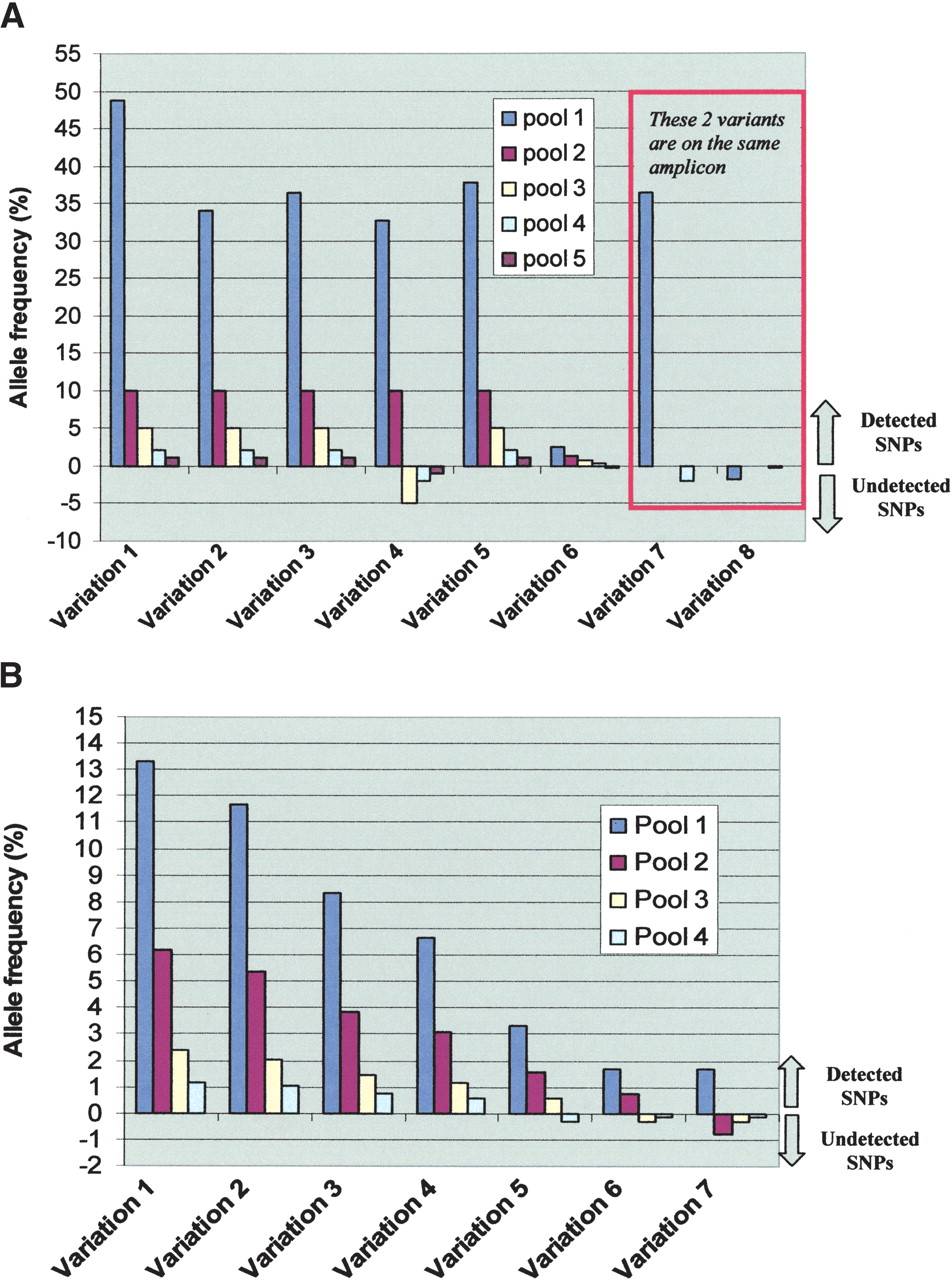
Detection of the various SNPs in the study. (A) Detection of known SNPs. This panel depicts the allele frequency (y-axis) of the seven detected variations in the four constructed genomic mixtures (x-axis) with data from each pool represented with a different color. Pool 1 is where all 94 samples are mixed. The other four pools are different mole DNA dilutions of the five-genome pool. To distinguish SNPs that were detected from those that were not detected in a particular genomic mixture in the MRD-based SNP discovery, we depict the undetected SNPs with negative allele frequency. Variations 7 and 8 are in the same amplicon. Sequence data for this amplicon was obtained for only two pools. Data from pool 1 of this amplicon demonstrates how the presence of a common variant (variation 7) masks other rare variant(s) (variant 8) in the same amplicon. (B) Detection of unknown SNPs. This panel depicts the allele frequency (y-axis) of the seven detected variations in the four constructed genomic mixtures (x-axis) with data from each pool represented with a different color. The four pools shown are for the different mole DNA dilutions of the five-genome pool. To distinguish SNPs that were detected from those that were not detected in a particular genomic mixture in the MRD-based SNP discovery, we depict the undetected SNPs with negative allele frequency. Some variations are detected when present at frequency as low as 0.5%.


