
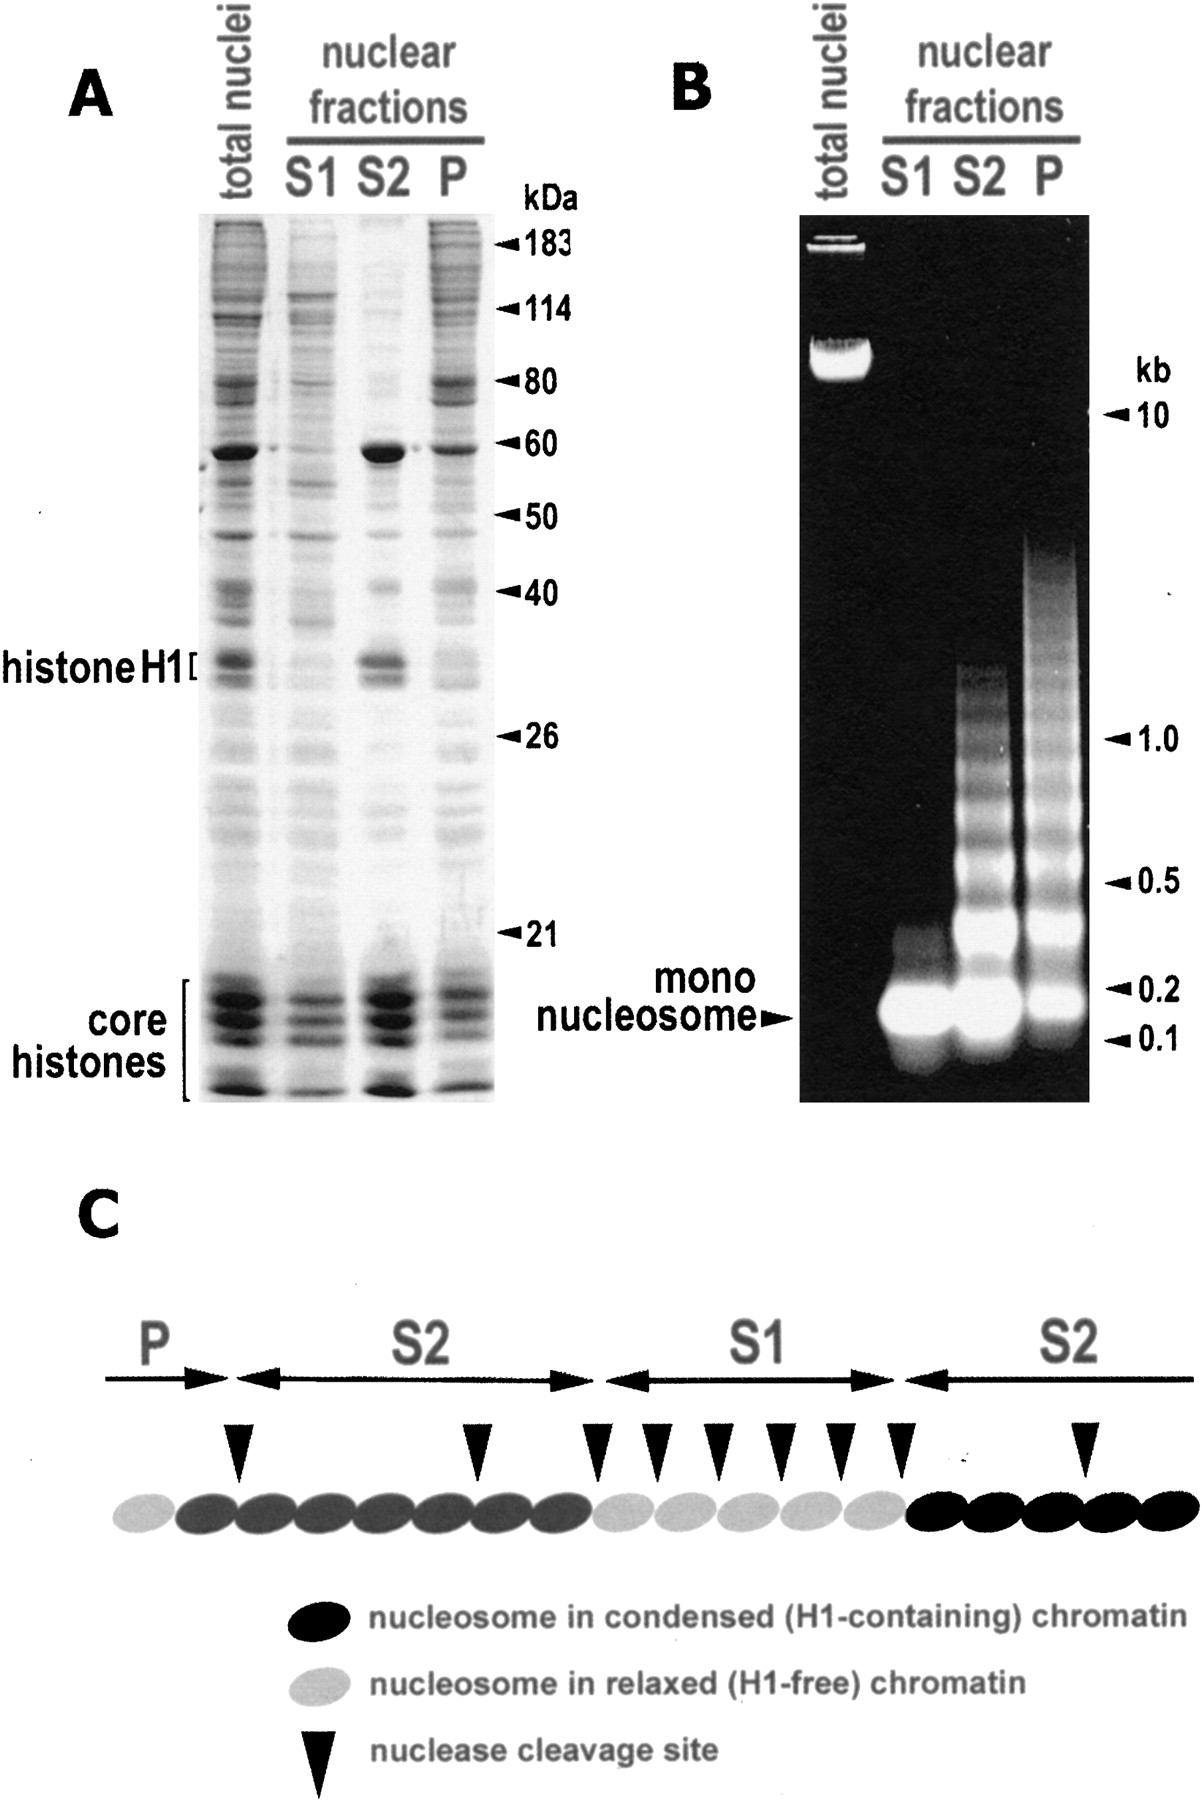
Figure 1
The chromatin solubility assay is used to extract the S1, S2, and P fractions, and the result of that process is depicted as the patterns seen in the gels of the resulting protein and DNA. The protein gel (A) shows the depletion of the H1 histone and the enrichment of nonhistone proteins in the S1 and P fractions. The DNA gel (B) shows the difference in the extent of the digestion between the fractions. The model (C) illustrates the basic concept of the chromatin fractionation assay.


