
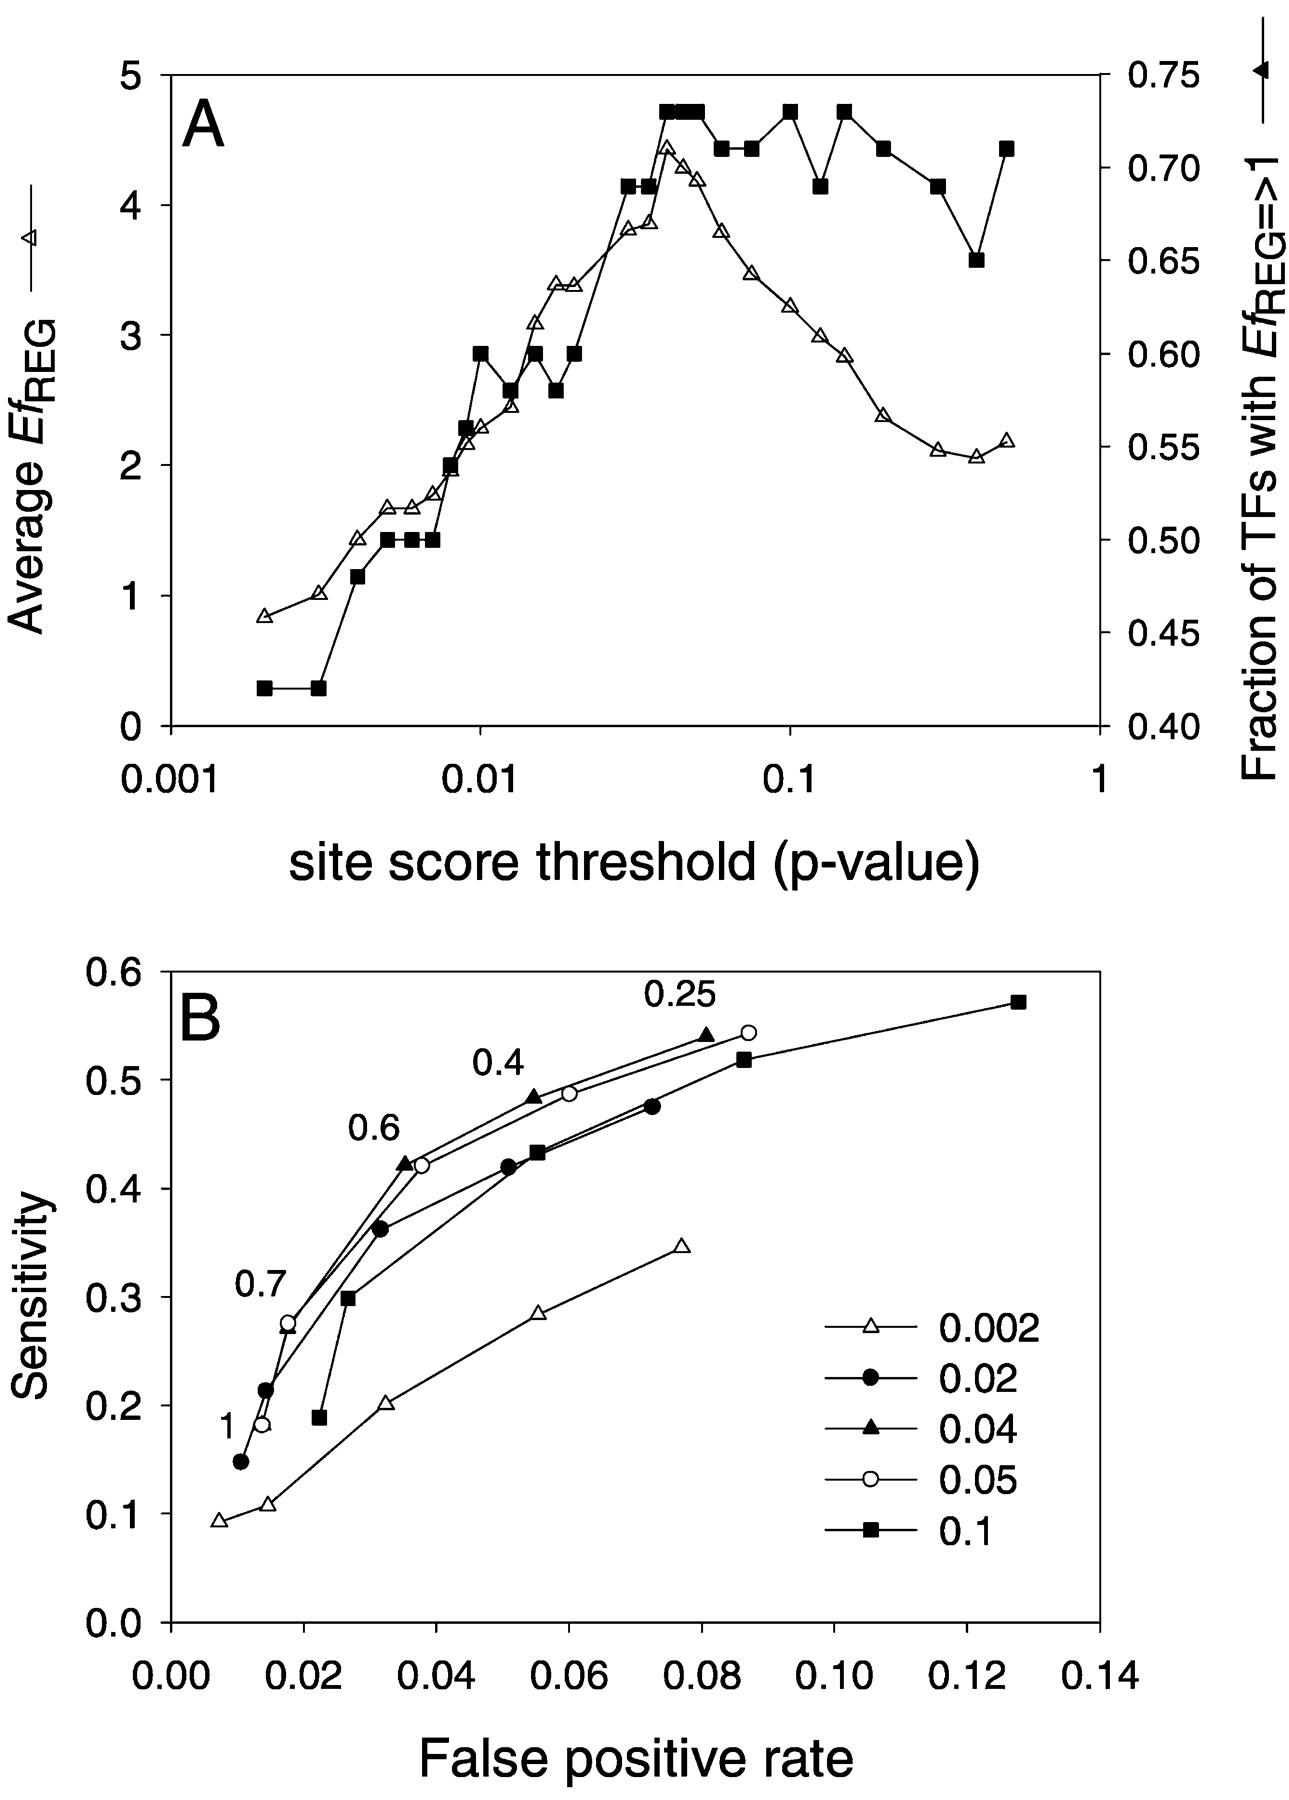
(A) Efficiency of Regulogger at different site-score thresholds used to predict regulons. Regulogger efficiency (EfREG) for the individual transcription factors was calculated on the basis of the sensitivity and specificity of the regulon and regulog predictions as described in the text. (B) ROC curve showing the sensitivity vs. false-positive rate of Regulogger. The ROC curves were calculated with different settings of the site-score threshold as indicated in the legend. The numbers in the figure indicate the various cut-off values for the RCS. The leftmost point in each curve corresponds to the most stringent cut off (RCS = 1); the rightmost point of each curve corresponds to an RCS of 0.25.


