
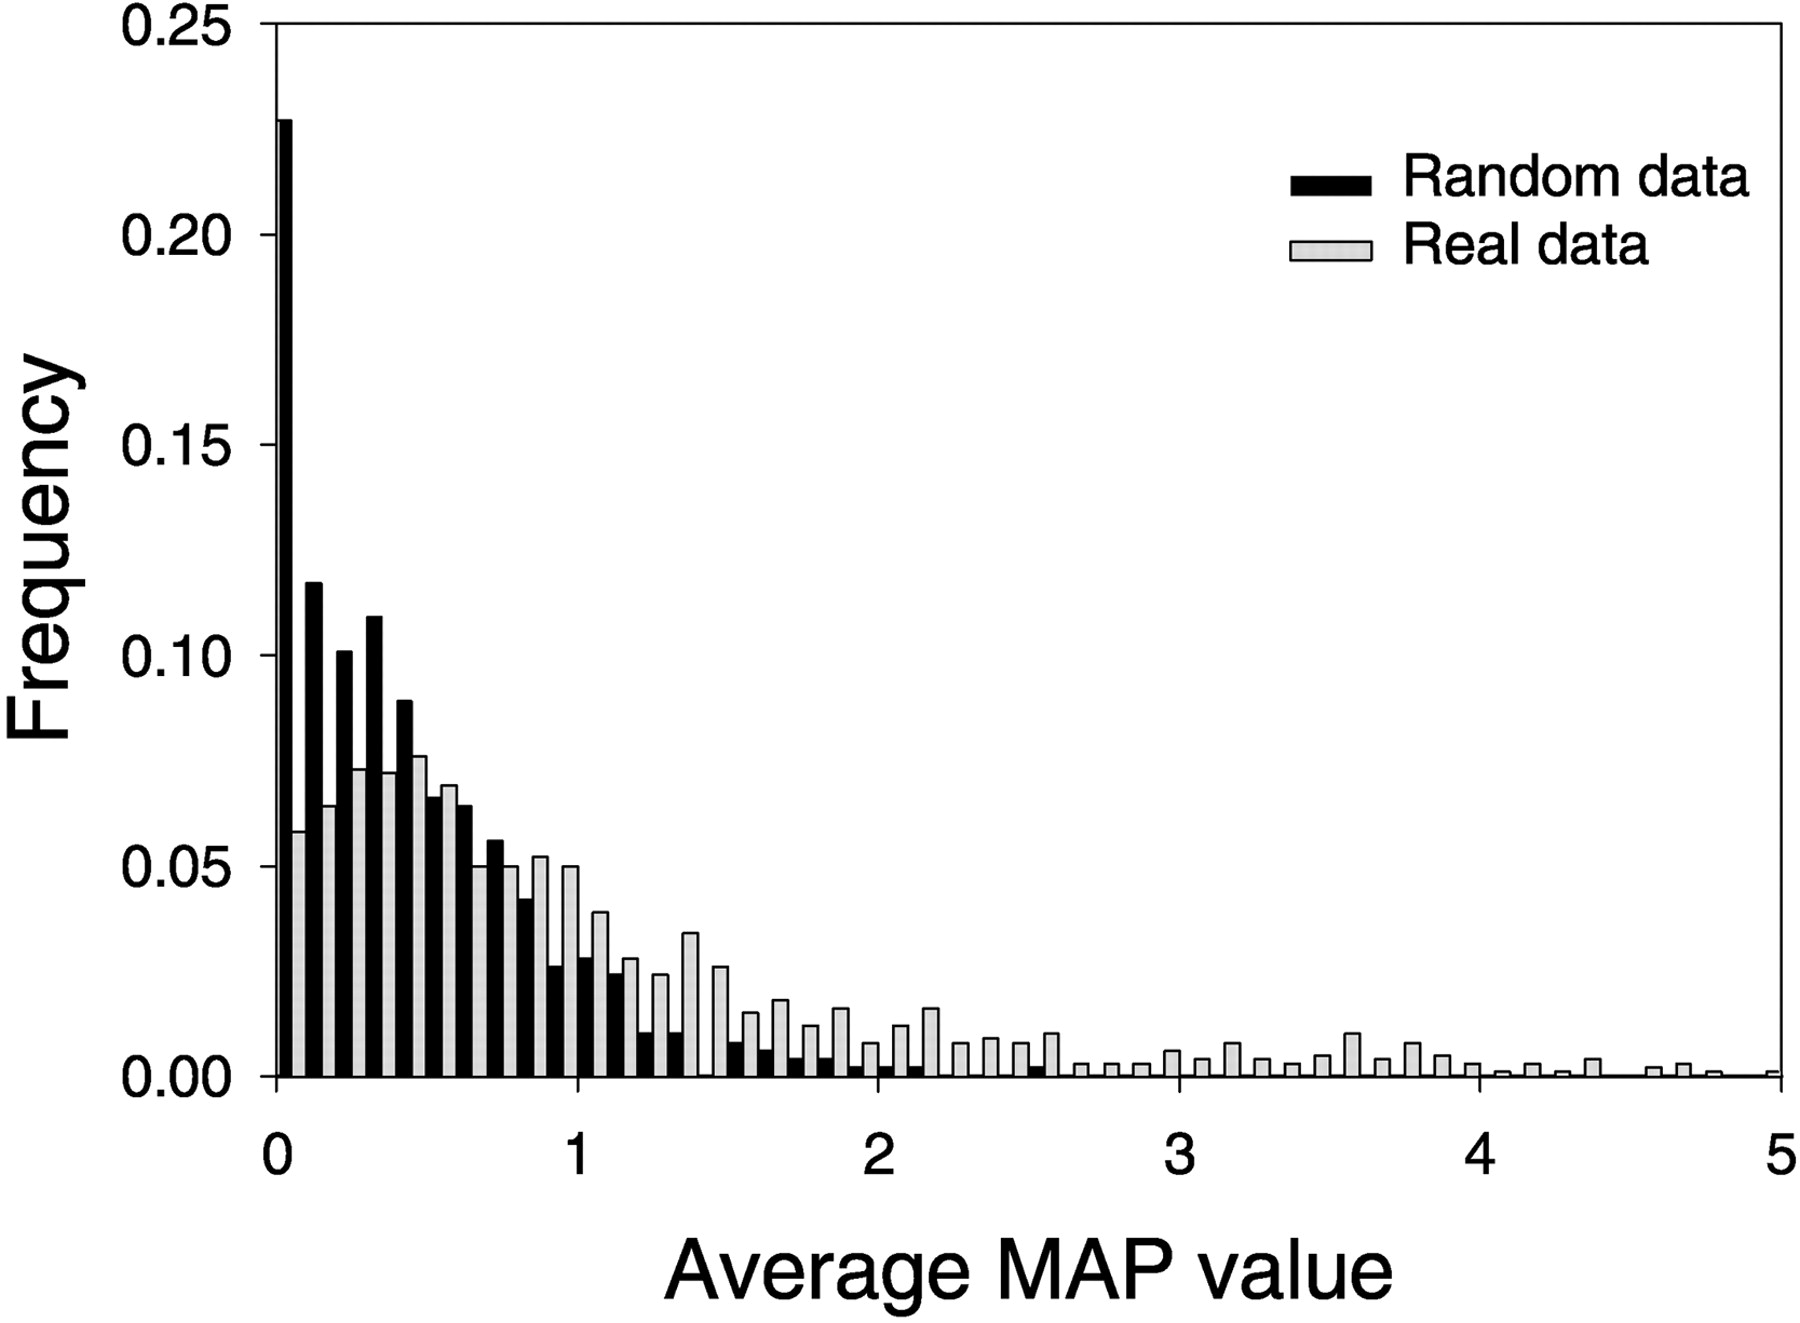
Figure 4
Phylogenetic footprinting on the genome of S. aureus. (Gray) The distribution of the average MAP-values that were obtained by performing Gibbs sampling on orthologous regulatory regions; (Black) the distribution of scores that were obtained using randomized upstream cis-REs with the same AT content, length, and average identity as the real orthologous regulatory regions.


