
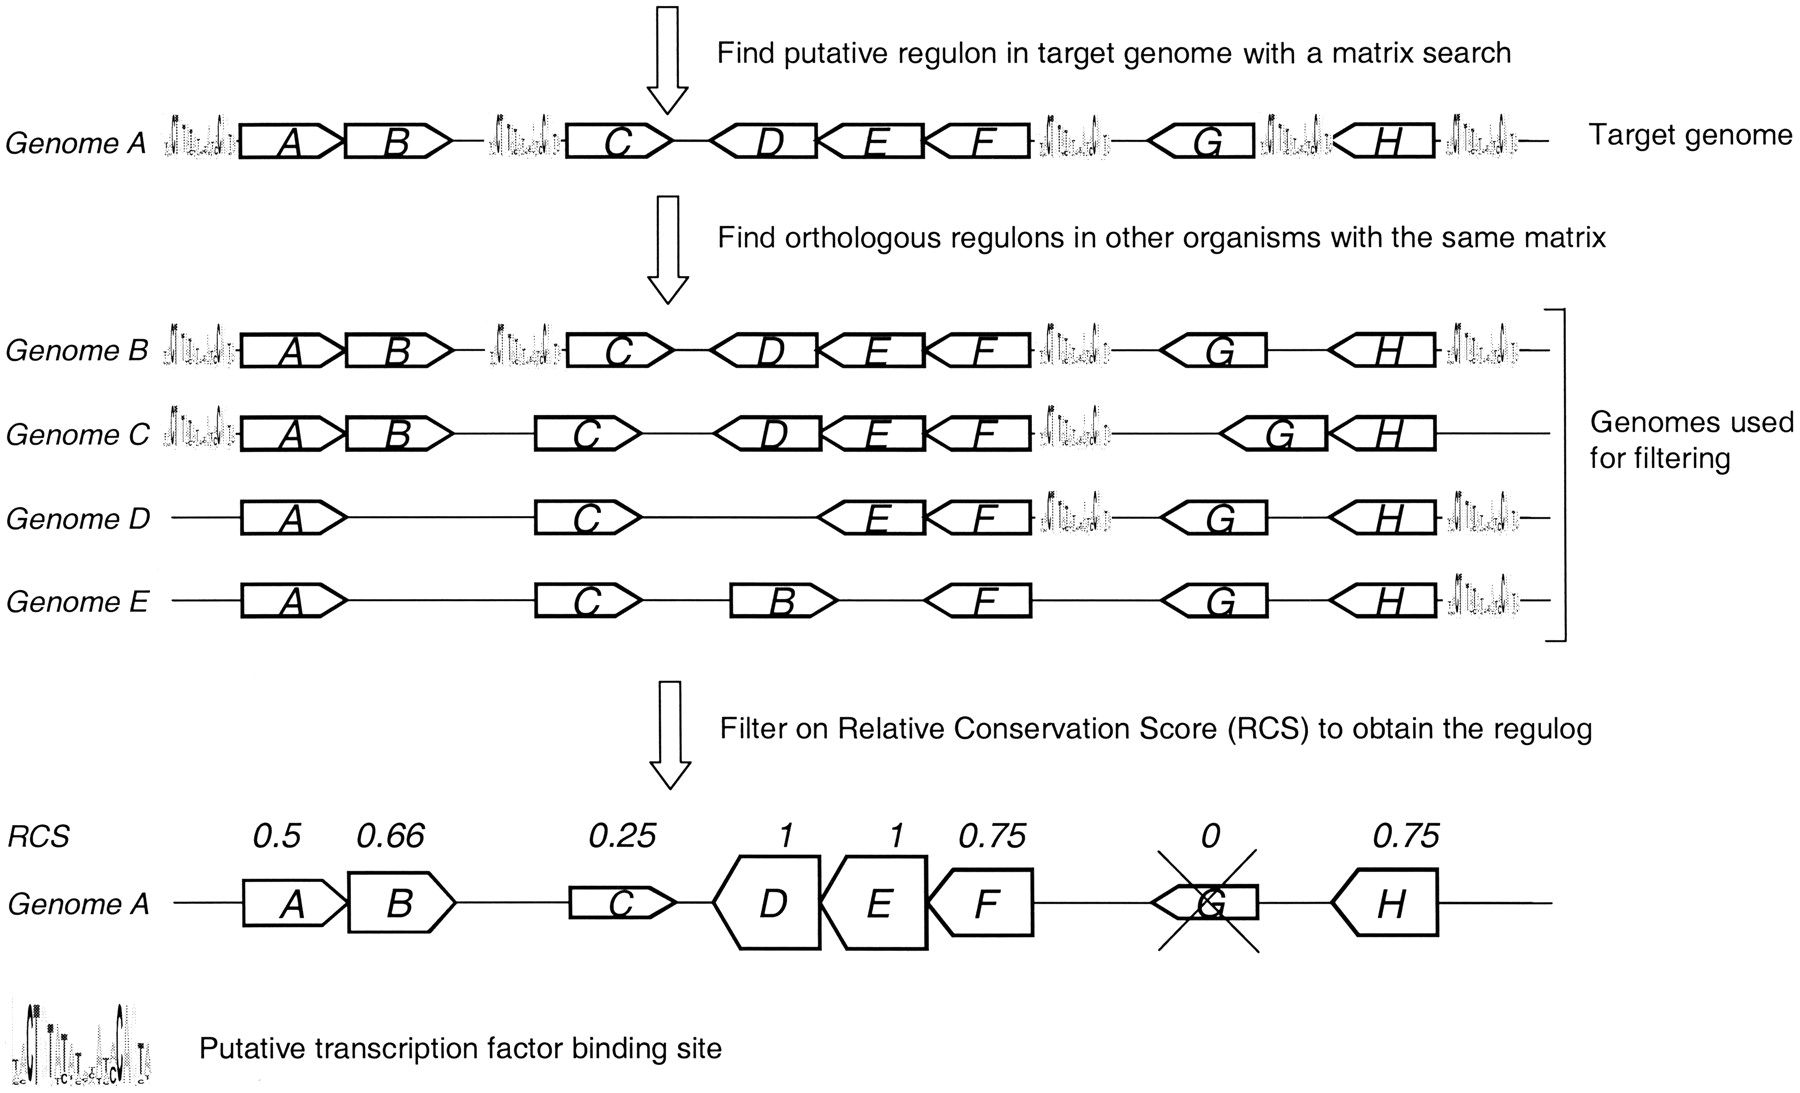
Outline of the Regulogger method. First a putative regulon in the target genome (Genome A) is predicted by searching the entire genome for genes with a particular cis-RE in their upstream region. This predicted regulon in genome A is shown at the top. Regulogger identifies regulons in other genomes (B, C, D, and E) that are regulated by the same cis-RE. On the basis of the fraction of orthologs in other genomes (indicated in this figure by the same letter) that are regulated by the same cis-RE, a relative conservation score (RCS) is calculated. The RCS is shown above the genes in the final regulog. The height of the box for each gene correlates to the RCS for that gene, and thus indicates the confidence of the predictions. Predicted regulon members that have an RCS of 0 are regarded as false-positive predictions and are not present in the final regulog.


