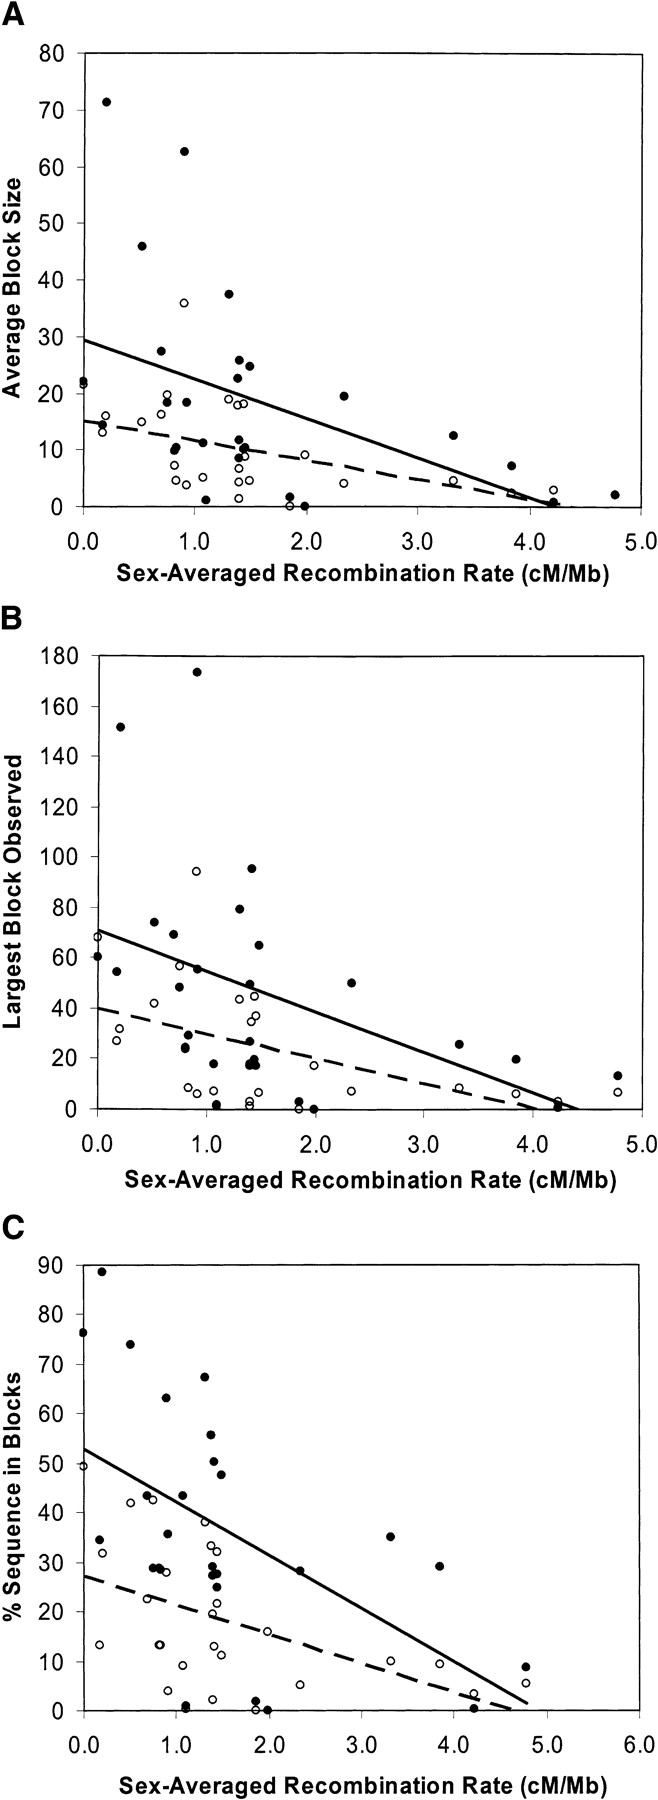
Scatter diagrams depicting the relationship between block structure and recombination rate using the haplotype block data from Gabriel et al. (2002) and the recombination rate data from Kong et al. (2002). (•) Block data obtained from the CEPH families. (○) Block data from the Yoruban samples. The solid and dashed lines are linear regression lines for block structures and recombination rates computed for the CEPH and Yoruban data, respectively. (A) The relationship between sex-averaged recombination rate and average block size. (B) The relationship between sex-averaged recombination rate and the size of the largest block observed in a region. (C) The relationship between sex-averaged recombination rate and percentage of sequence in a region found to be in a block.


