
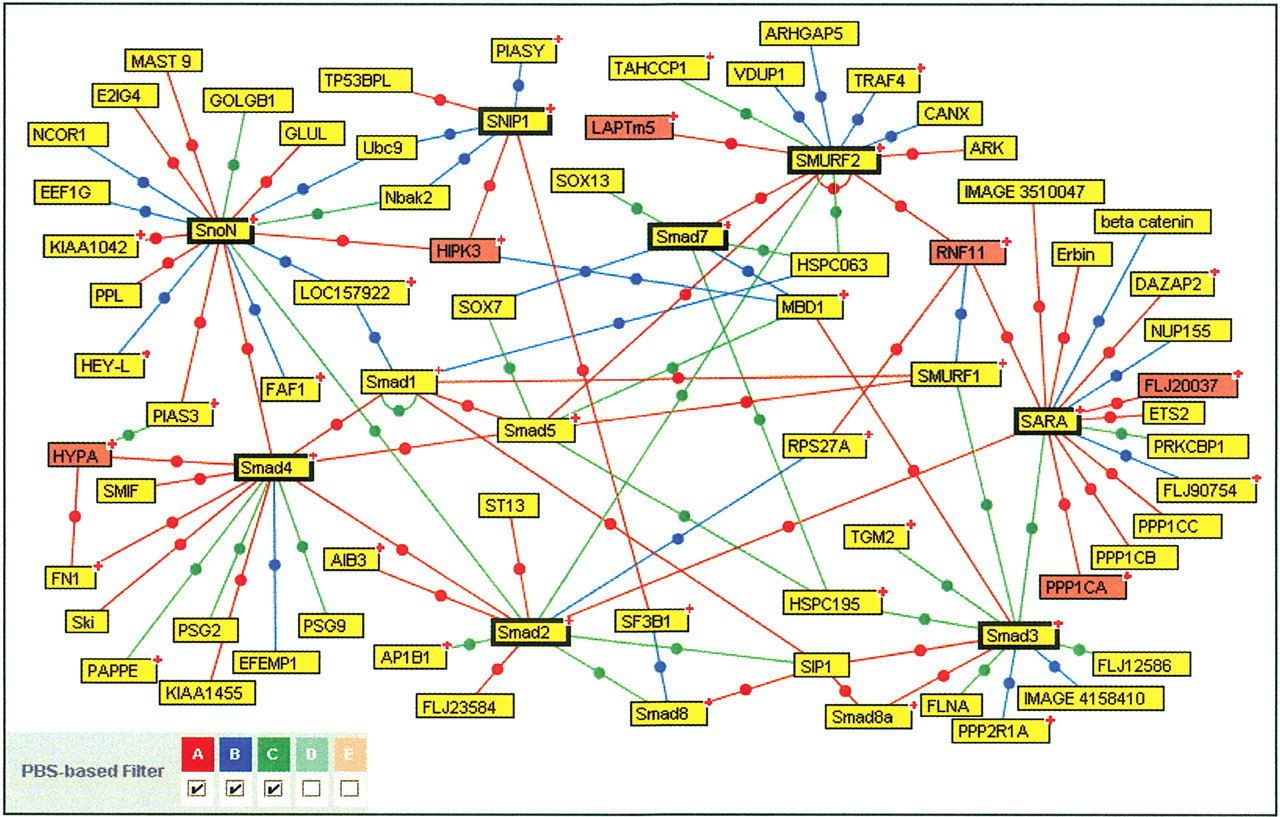
Protein interaction map around some selected baits in the TGFβ pathway. PBS D and E interactions as well as protein interactions corresponding to the BMP pathway have been excluded from this map for clarity (however, all data are available on the PIMRider visualization platform at http://pim.hybrigenics.com). The following bait proteins were selected to generate a TGFβ network: Smad2, 3, 4, 7, SARA, Smurf2, SnoN, and SNIP1. These are represented in boxes with heavy outlining. Of the 14 proteins selected for further functional validation, the six proteins present in this figure are represented in red. The (+) symbol located in the upper right corner of some boxes indicates that additional partners are not represented in this figure but are visible on the Web site mentioned above.


