
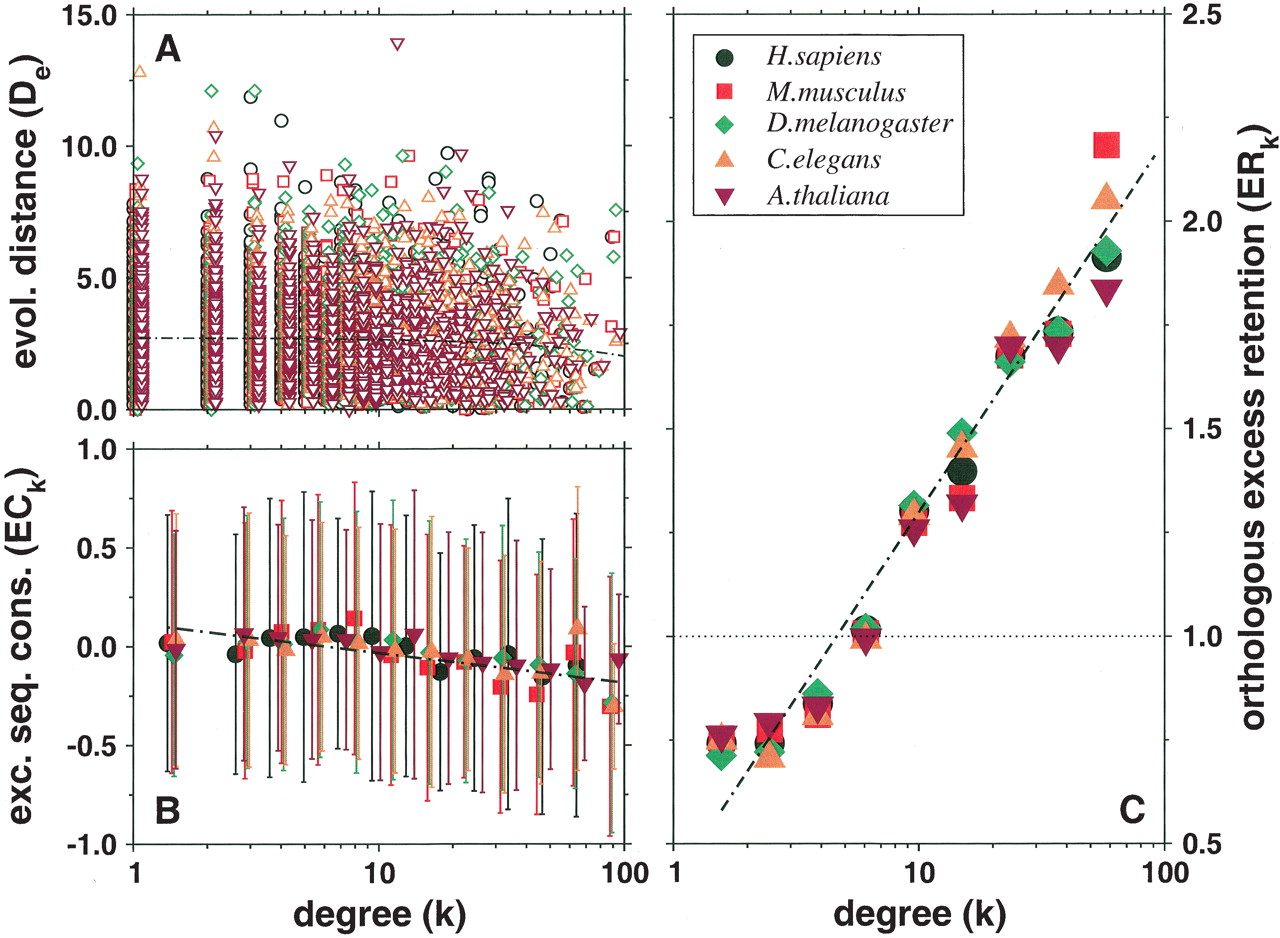
(A) Scatterplot showing for each yeast protein the evolutionary distance D to its orthologs in a higher eukaryote as a function of the proteins' number of interactions k. The thin black line corresponds to D ∼ αk with  . (B) By applying logarithmic binning to the horizontal k-axis, we obtain improved correlations of the excess sequence conservation ESCk on k (〈ESCk〉 ∼ βlog k,
  . (C) The orthologous excess retention parameter ERk shown as a function of logarithmically binned ks indicates a statistically significant monotonic trend toward the conservation of the more connected proteins (ERk ∼ γlog k,
  ). In each plot, the symbols correspond to the orthologs of S. cerevisiae identified in the higher organisms listed in the legends box of C.


