
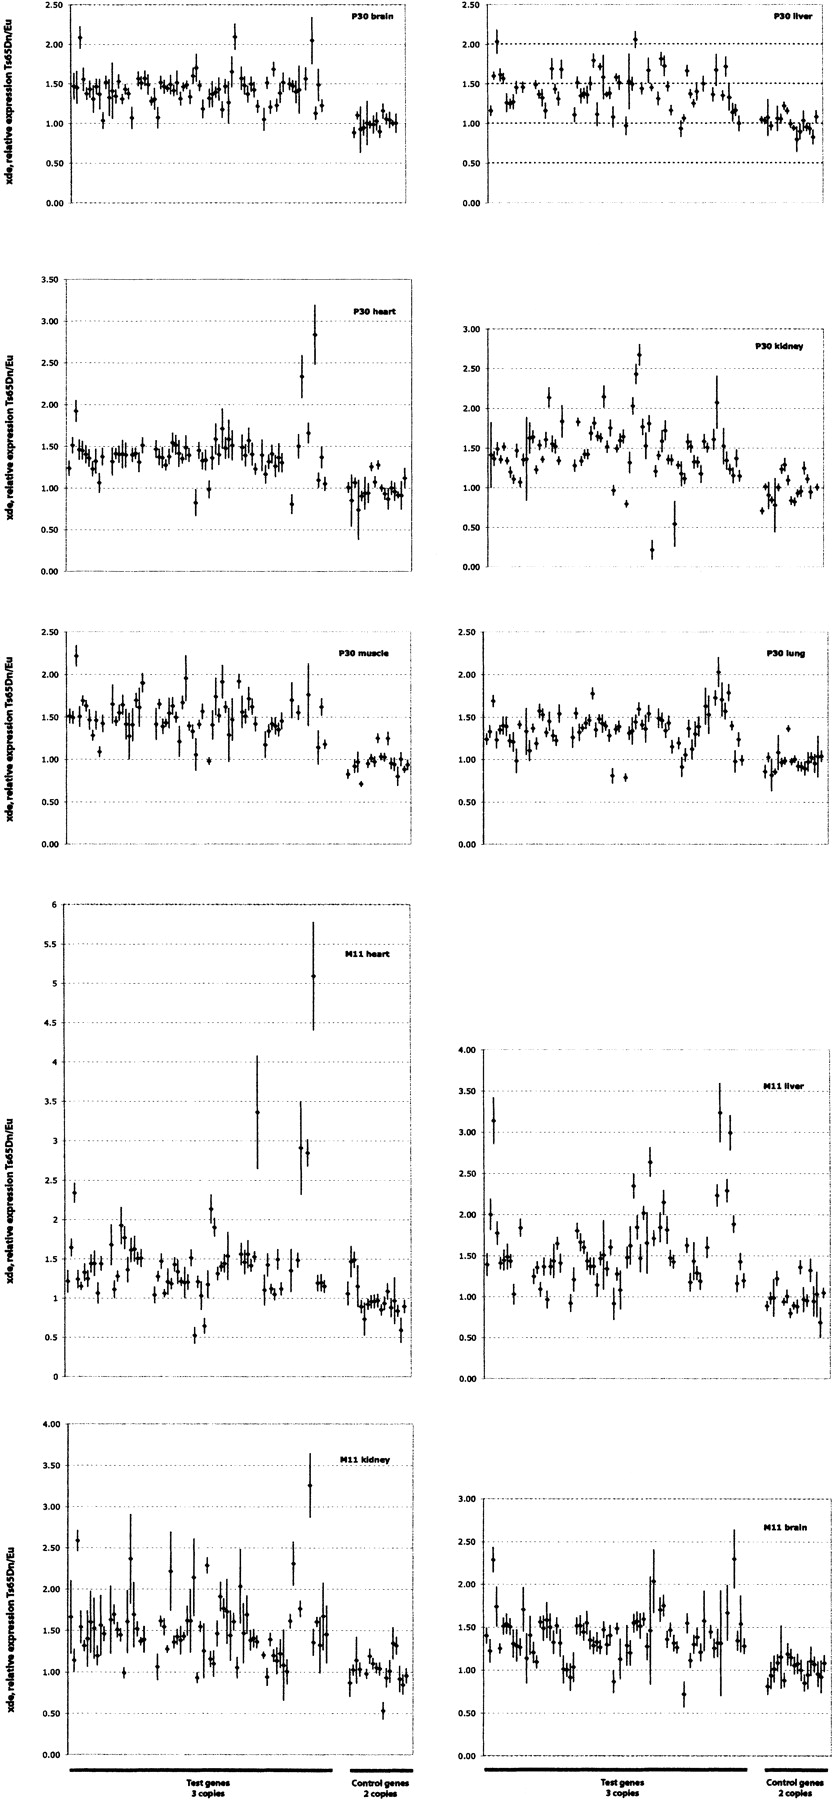
Figure 4
Graphs of normalized relative expression Ts/Eu (xΔe). Points represent the values from Figure 2 and bars represent the 95% CI of these values. The x-axis has genes plotted along mouse Chromosome 16 for the test genes. The y-axis represents xΔe. The list and order of genes for each tissue is given in Figure 2.


