
Figure 3
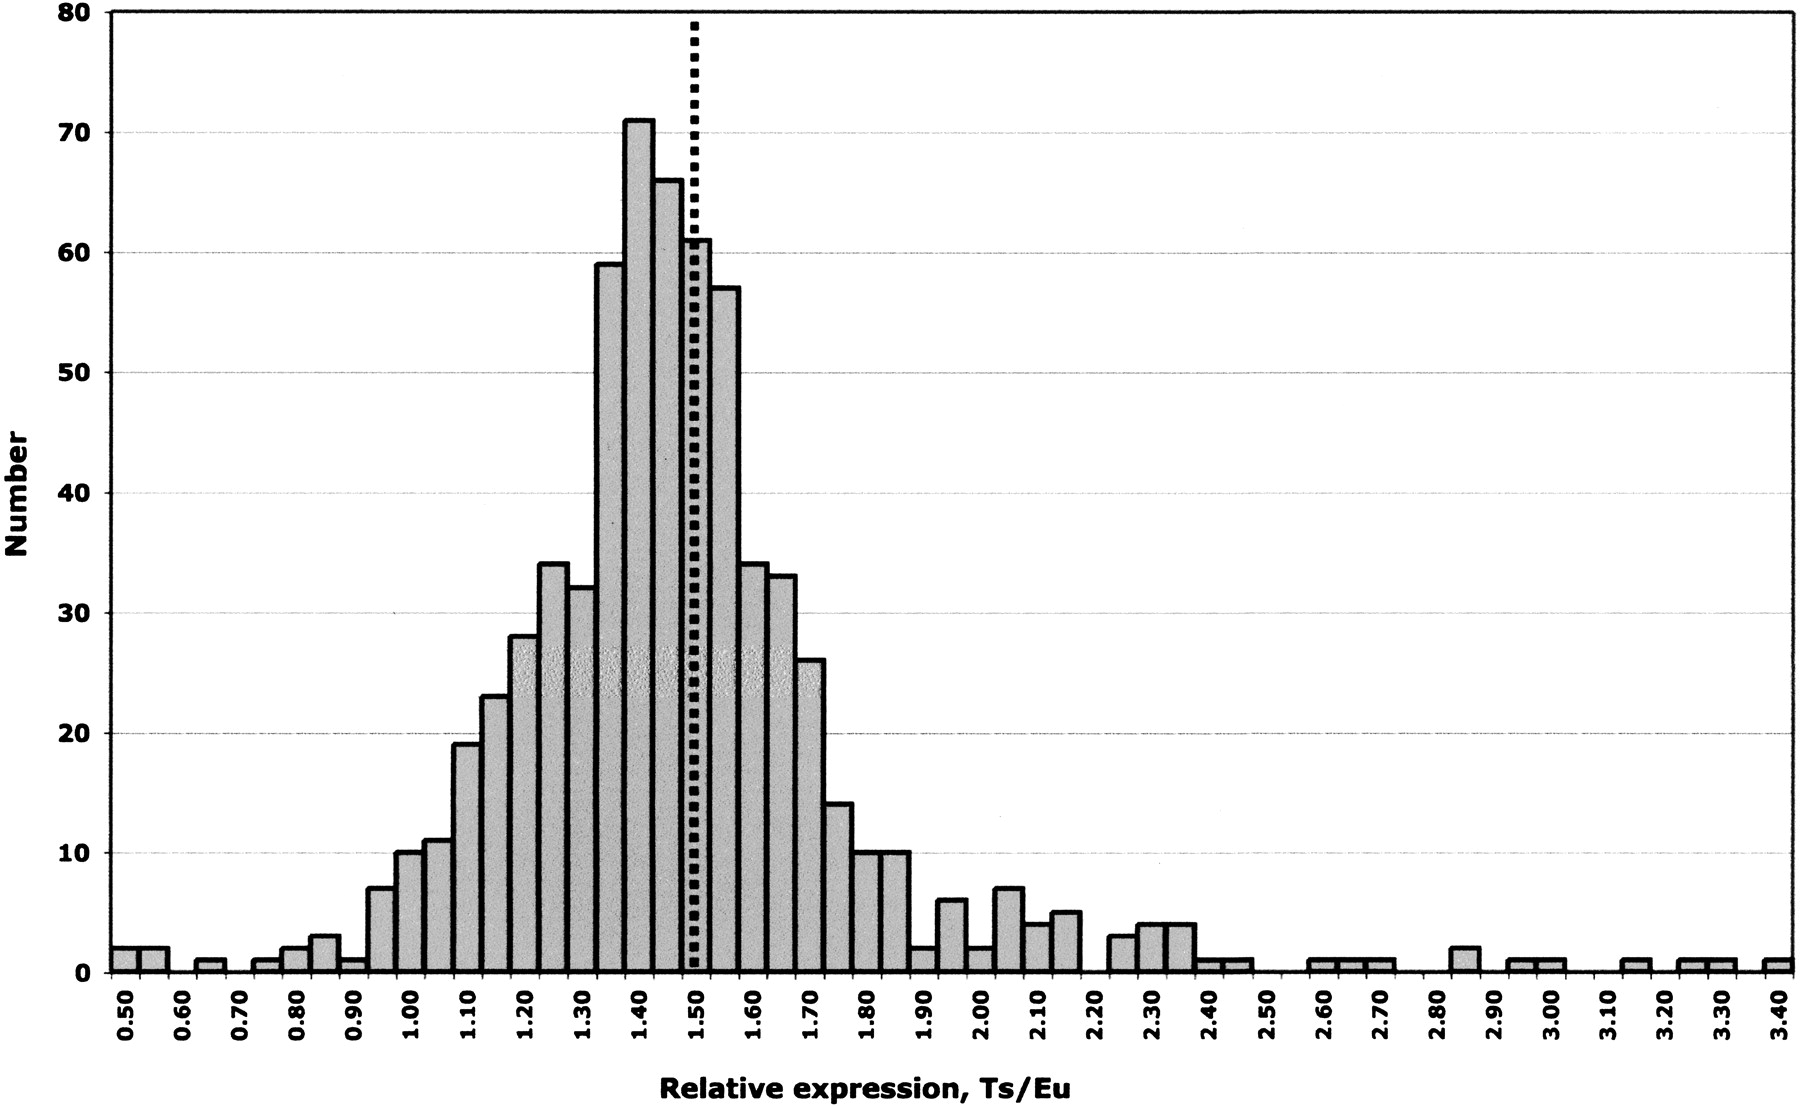
Histogram of normalized relative expression Ts/Eu (xΔe). The values from Figure 2 are plotted into bins differing by 0.05. The dotted line indicates the position of the value 1.5.
(Downloading may take up to 30 seconds. If the slide opens in your browser, select File -> Save As to save it.)
Click on image to view larger version.
Histogram of normalized relative expression Ts/Eu (xΔe). The values from Figure 2 are plotted into bins differing by 0.05. The dotted line indicates the position of the value 1.5.
 CiteULike
 Delicious
 Digg
Digg Facebook
 Google+
 Reddit
 Twitter
