
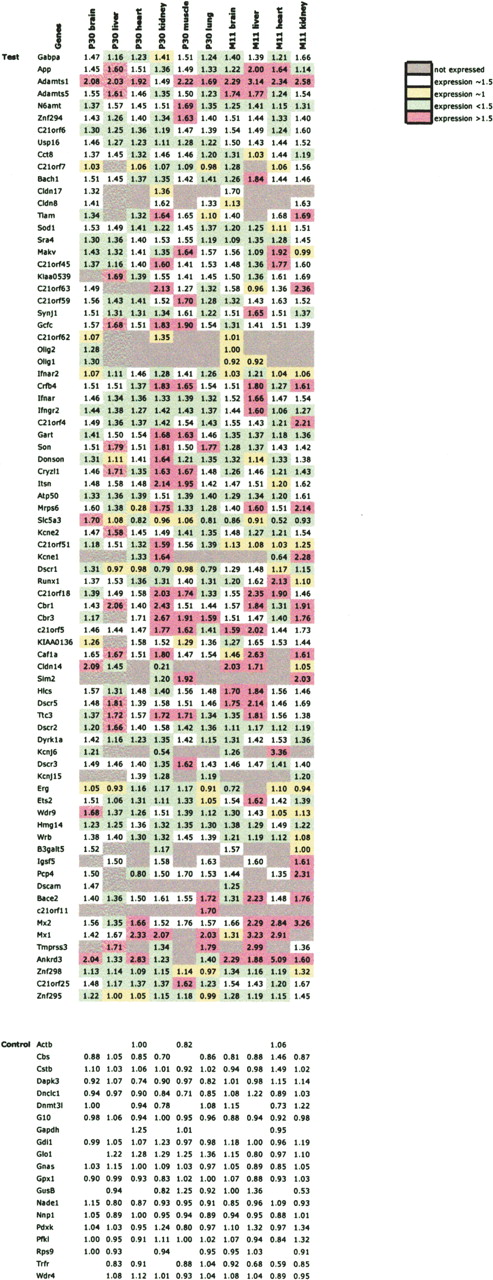
Figure 2
Normalized relative expression Ts/Eu (xΔe). The values are the expression of a gene for Ts65Dn relative to Eu for the tissues and stages shown. The colors represent expression relative to the theoretical values 1.5 and 1.0, based on 95% CI for the values.


