
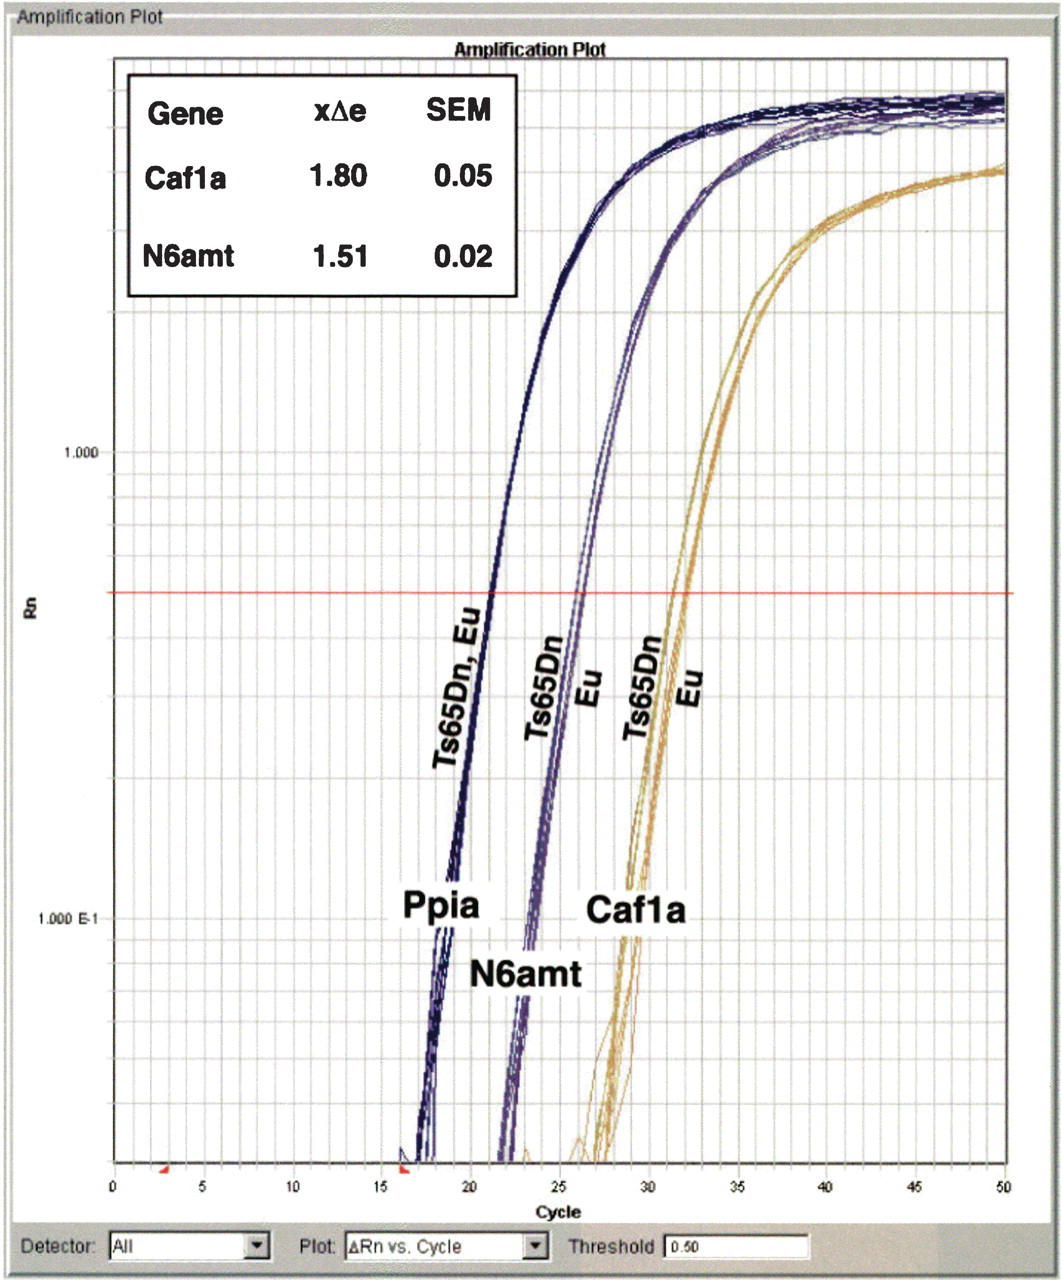
Figure 1
Example of Taqman real-time PCR amplification plot from P30 kidney of Ts65Dn and euploid mice. Two test genes (N6amt and C21orf18) and one normalization gene (Ppia) are shown. For each mouse genotype and gene there are five replicates. (Inset) The normalized relative expression of Ts65Dn to euploid (xΔe) and the standard error (SEM).


