
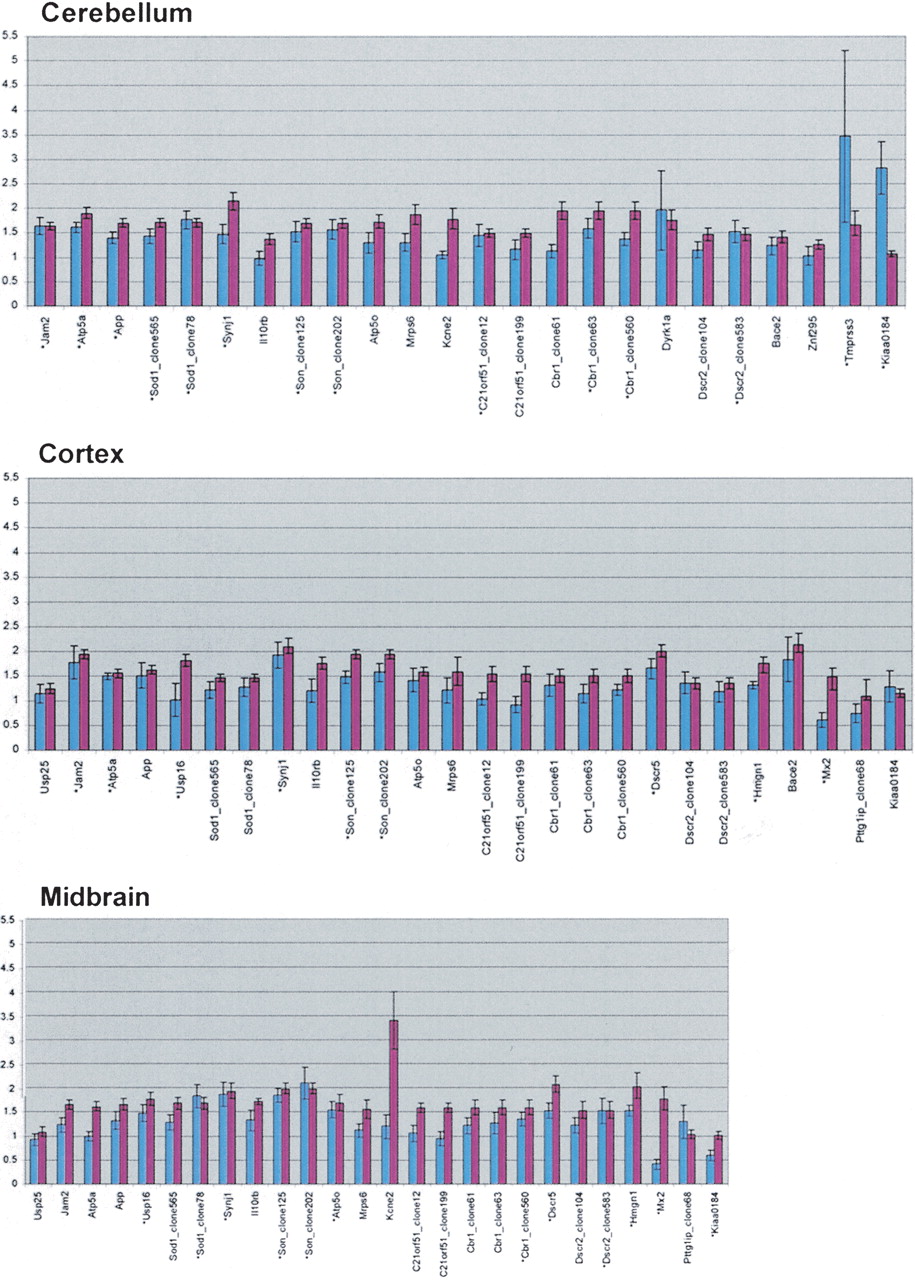
Comparison of trisomic/euploid ratios obtained by real-time PCR and arrays for the three brain regions. Histograms showing the correlation between array and qPCR results for cerebellum, cortex, and midbrain. Blue bars represent mean ratios of three independent array hybridizations, and red bars represent mean ratios of two independent qPCR experiments. Error bars were calculated by averaging standard deviations of the independent experiments. Genes represented by 1–3 clones on the arrays were independently compared to the qPCR result. (*) beside a gene name indicates an array ratio (blue bar) with a significant P-value (<0.05). Correlation histograms for all tissues are available in Supplemental Figure 2.


