
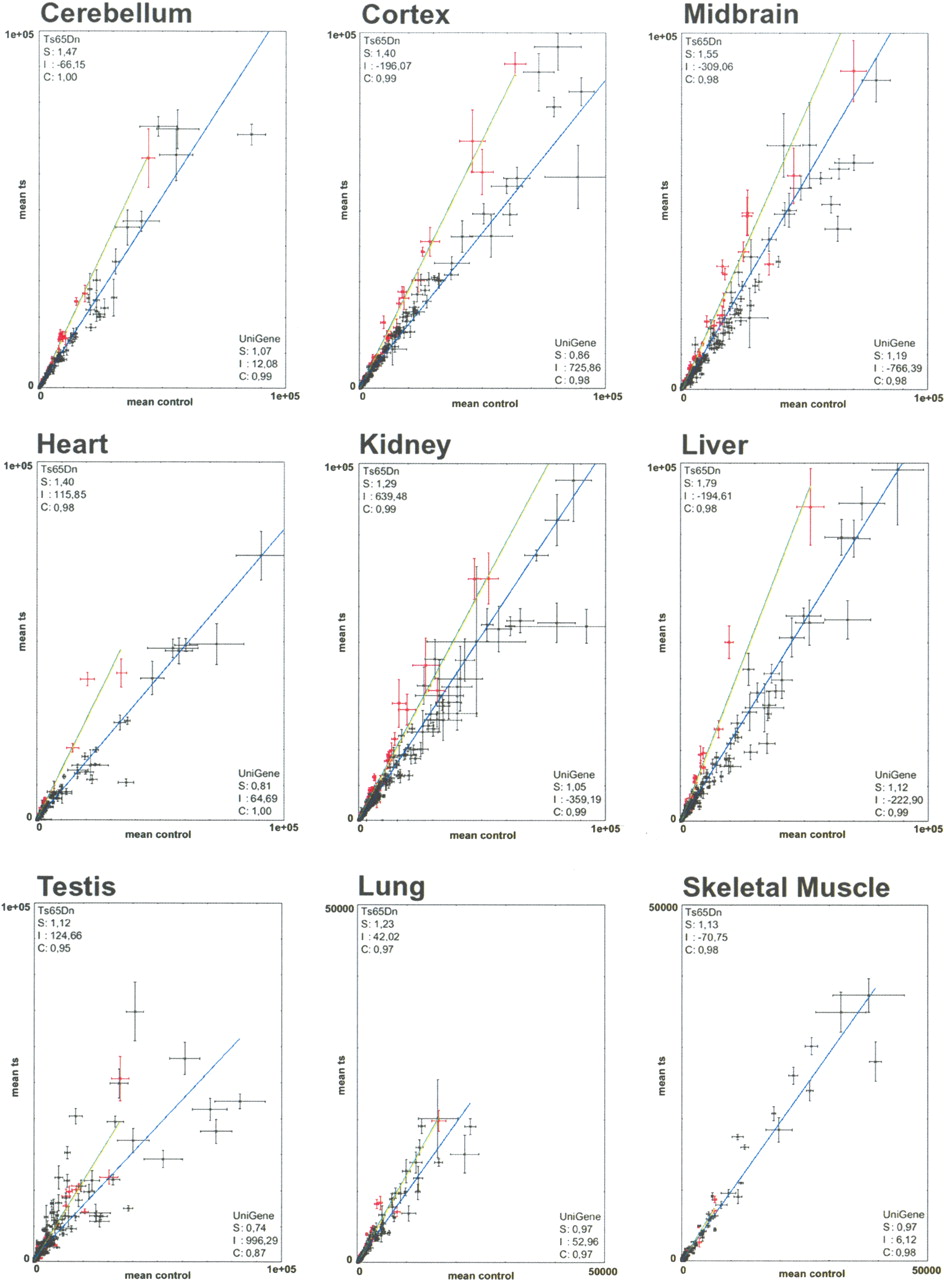
Linear regression plots comparing trisomic and control samples. For each plot corresponding to a given tissue, the linear regression for the triplicated genes is in green, and that of the UniGene sample is in blue. Each clone was plotted using the average of its normalized spot intensities obtained in the replicated hybridizations, with the value in control tissue on the x-axis and with the value in Ts65Dn tissue on the y-axis. Bars show the interval [μ–σ,μ+σ] where μ and σ are the mean and standard deviation, respectively, for each data point across the replicated experiments. We excluded from the graphics outlier spots with intensities ±4 std. dev. above the mean intensity (e.g., Wrb). (S) is the slope for the regression line, (I) the intercept, and (C) the correlation. Scales range from 0–100.000, except for lung and skeletal muscle, which range from 0–50.000.


