
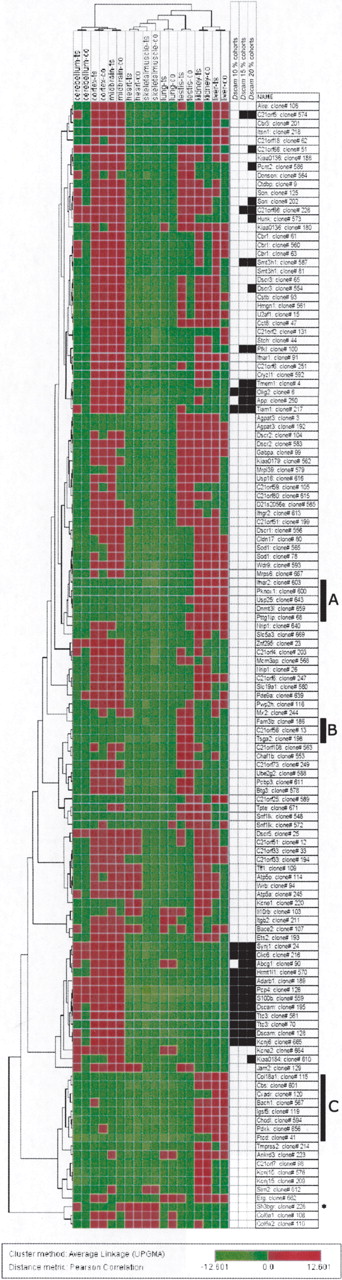
Hierarchical clustering showing the expression levels of mmu21 genes across nine tissues of the control mice and Ts65Dn mice. For each clone we calculated the logarithm (base 2) of the ratio between the normalized intensity in the specific tissue and the average of intensities of this clone across the nine control tissues. Spot intensities below the average of intensities across all tissues give log-ratio values ranging from –12.6 to 0, and are represented by a color gradient spanning from light to dark green. Conversely, spot intensities above the average of intensities across all tissues give log-ratio values ranging from 0 to +12.6, and are represented by a color gradient spanning from dark to light red. Thirty-one clones (24 genes) that did not show significant expression values across all control tissues were excluded from the clustering; 130 clones (112 genes; rows) and nine tissues of control and TS65Dn mice respectively (columns) were clustered using the average-linkage hierarchical clustering method with Pearson correlation as similarity measure (J-Express V 2.1; www.molmine.com). Additionally, clones with the most similar expression profiles to Dscam (with respect to the Pearson correlation) are displayed: 10% closest (13 clones, left column), 15% closest (20 clones, middle column), and 20% closest (26 clones, right column). Note that in hierarchical clustering procedures, clones with similar expression profiles can be split to different parts of the dendrogram (e.g., Olig2) and vice-versa (e.g., Abcg1). Genes referenced in the text are highlighted as follows: *, Sh3bgr; Black bars: A: Group of genes highly expressed in the kidney and the liver (from Ifnar 2 to Pttg1ip, P-value = 1.05 10–4) of controls and trisomics. B: Group of genes with predominant expression in the testis of controls and trisomics. C: Cluster of genes highly expressed in the kidney and the liver (from Col18a1 to Ftcd, P-value = 5.84 10–3) of controls and trisomics. An interactive version of Figure 3 is given in Supplemental Figure 3.


